The AUD and ASX 200 (AUS200) have commanded the focus right now. This won’t surprise given we got to react to the final report from the Royal Commission, as well as the highly anticipated RBA meeting.
While I can say this with hindsight, the risk today was that the AUD would rally on the RBA statement, with the tone failing to meet the 88% chance of a rate cut priced into swaps markets by 2020. Certainly, reading through the statement, we see no real change to its neutral bias, and despite calls from all circles of the market to adopt an easing bias, Dr. Lowe and team have stuck to their guns. Although they have certainly explored the risks more intently, describing the domestic economy as ‘reasonable’.
We look forward to Dr. Lowe's speech tomorrow in Sydney titled ‘The Year Ahead’ which precedes Fridays SoMP, where we should see some punchy cuts to the bank's GDP forecasts. That said, it is abundantly clear that once again the RBA has shown us the barrier to cut the cash rate is so incredibly high.
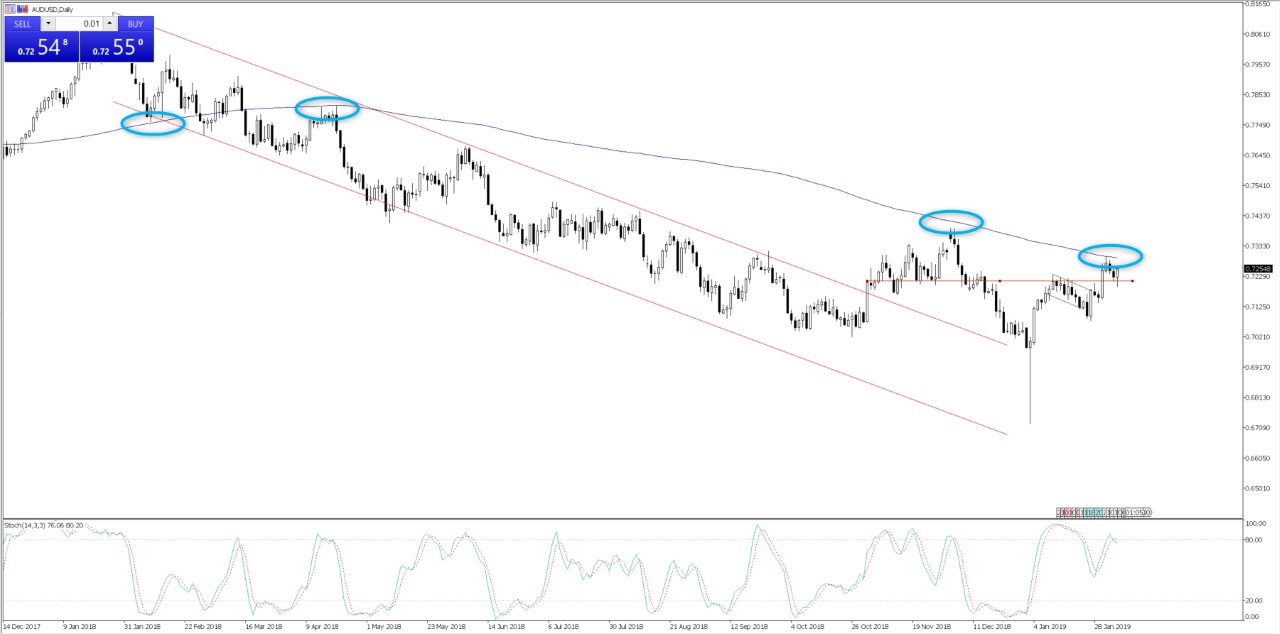
We’ve seen Aussie 3-year bond yields push up four basis points, which has reflected in AUDUSD pushing up 30 odd pips into 0.7260, and pushing through yesterday’s high of 0.7254. Let’s see how Europe react here, but the lack of selling in Aussie equities suggests traders don’t necessarily see this as a glaring policy error like they did when the FOMC said their balance sheet normalization program was on auto-pilot and failed to change its guidance. The risk of a further squeeze higher in AUDUSD is high, although, the 200-day MA (currently 0.7293) has acted a good level to fade strength.
If we look at the ASX 200/ASX 200 financial sector ratio, we can see the ASX 200 has strongly outperformed the financial sector really since April 2017. Overseas investors have long been advocates of using the banks as a vehicle to express the housing bubble, with aggressive short positions.
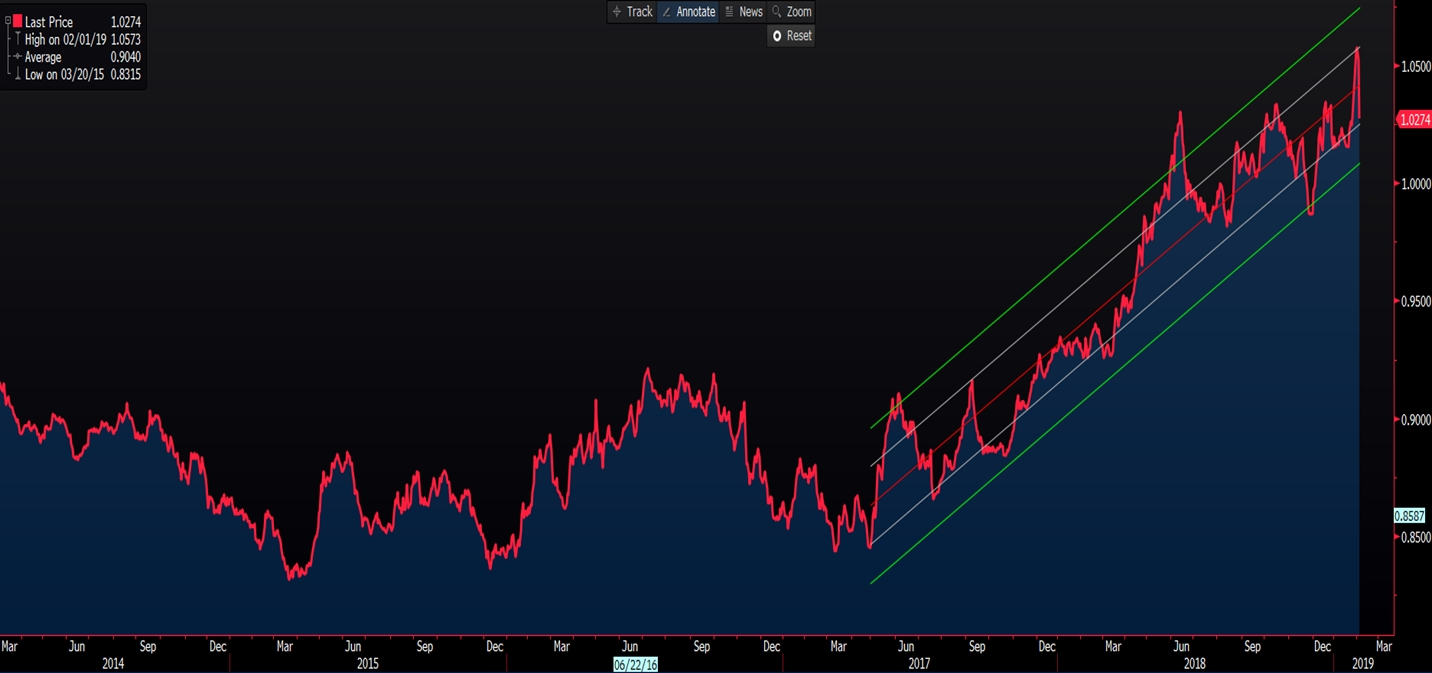
However, like any tactical trade, timing this has been key, and it has been a tough because in a low yield environment any asset giving investors a 6% yield will be hoovered up every day of the week.
We can see the ratio falling today, with financials holding its best one-day rally since March 2009, with traders expressing relief that there were no radical announcements or structural changes. I would expect this ratio to head a little lower and into the two standard deviation line of the current uptrend, where I would expect the bullish trend then to resume.
There seems little doubt that the rally in the banks has been significantly impacted by short covering.
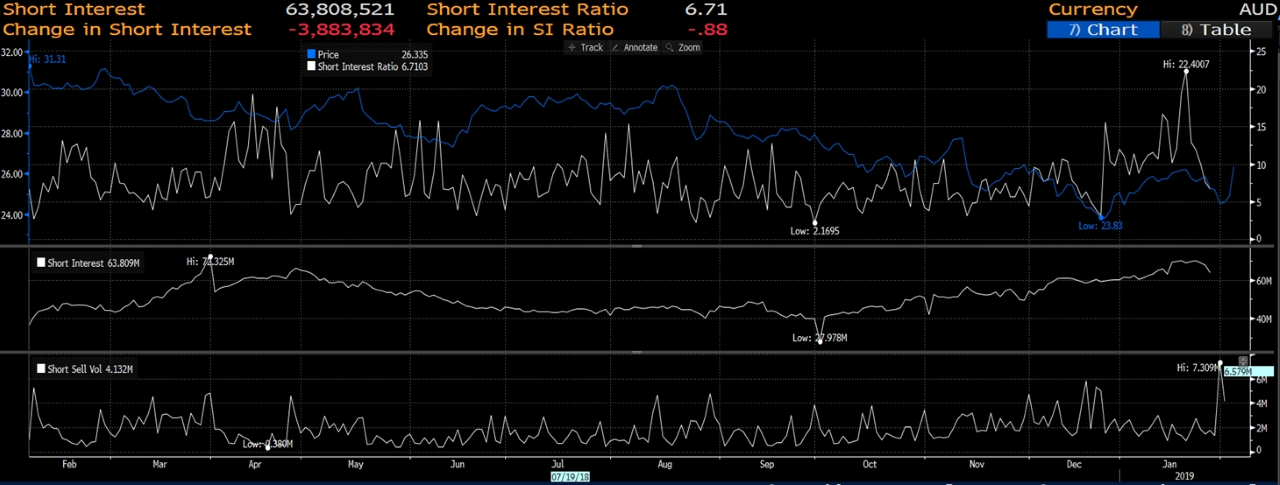
I’ve picked out Westpac (AX:WBC), as it has the highest exposure to the Sydney property market, which is at the heart of the concerns. Here, we can see short interest has been falling of late, and while the data is a few days old, we can still see the short interest ratio has dropped from 22% to 6.7%.
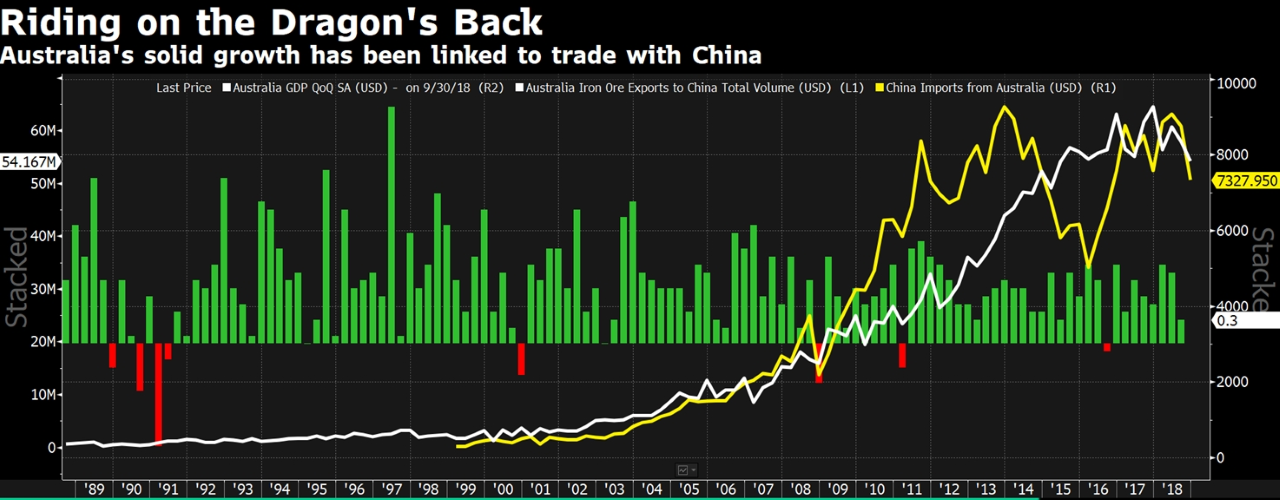
I felt this chart published by Bloomberg was worth sharing and highlights Australia’s leverage to the Chinese economy. One to keep an eye on, because the last thing we need to see is demand from China dropping off, at a time when there are further downside risks to property and therefore the potential for a loss of jobs in the construction space, which accounts for around 10% of Australia's labour market.
US Equity Indices
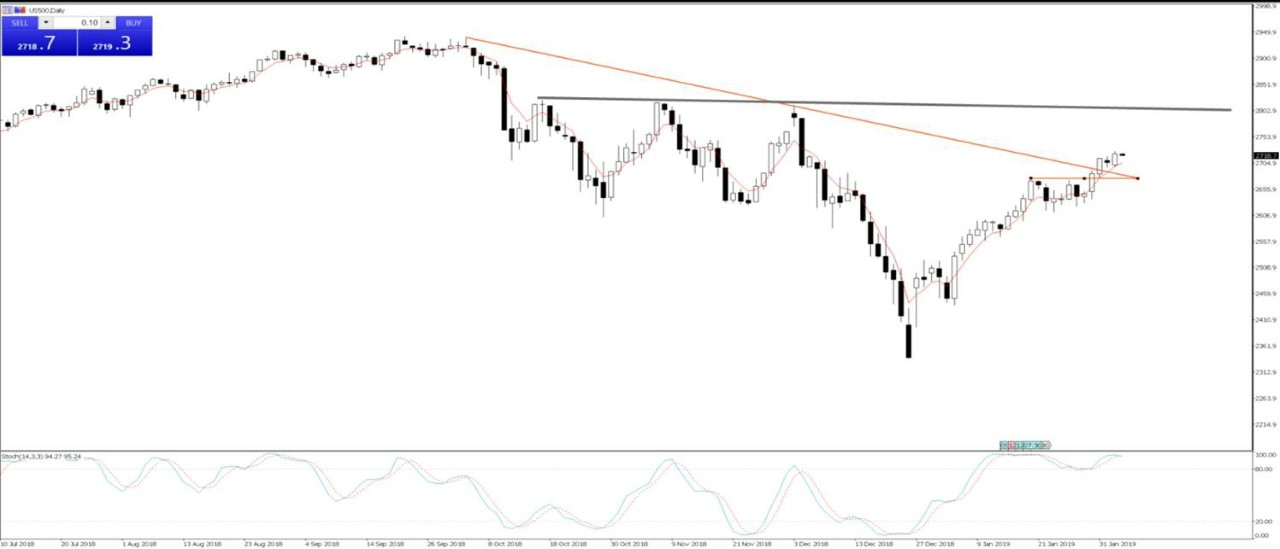
On the daily chart, we can see an interesting set-up on the S&P 500 (US500). The bulls are in control here, with the obvious target being the October/November range high of 2815. Despite the rising risk of a recession priced by markets. Friday's solid payrolls and the improvement seen in ISM manufacturing report, when married with disinflation, lower bond yield, dovish Fed and additional liquidity, has seen some label this the ‘goldilocks’ backdrop for equity appreciation.
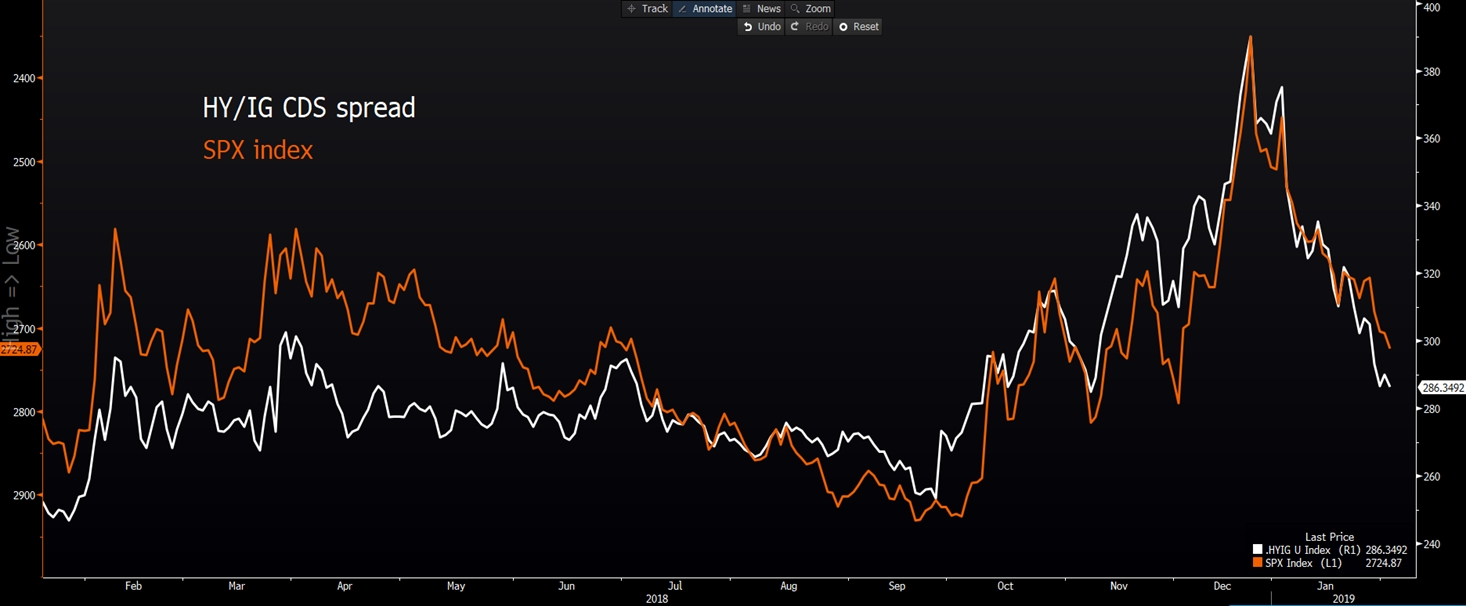
High yield (HY) credit is working like a dream right now, with the spreads over Investment-Grade credit coming in sharply. Equity traders will watch this closely, as credit leads equity, and I have again overlapped (and inverted) the S&P 500 here.
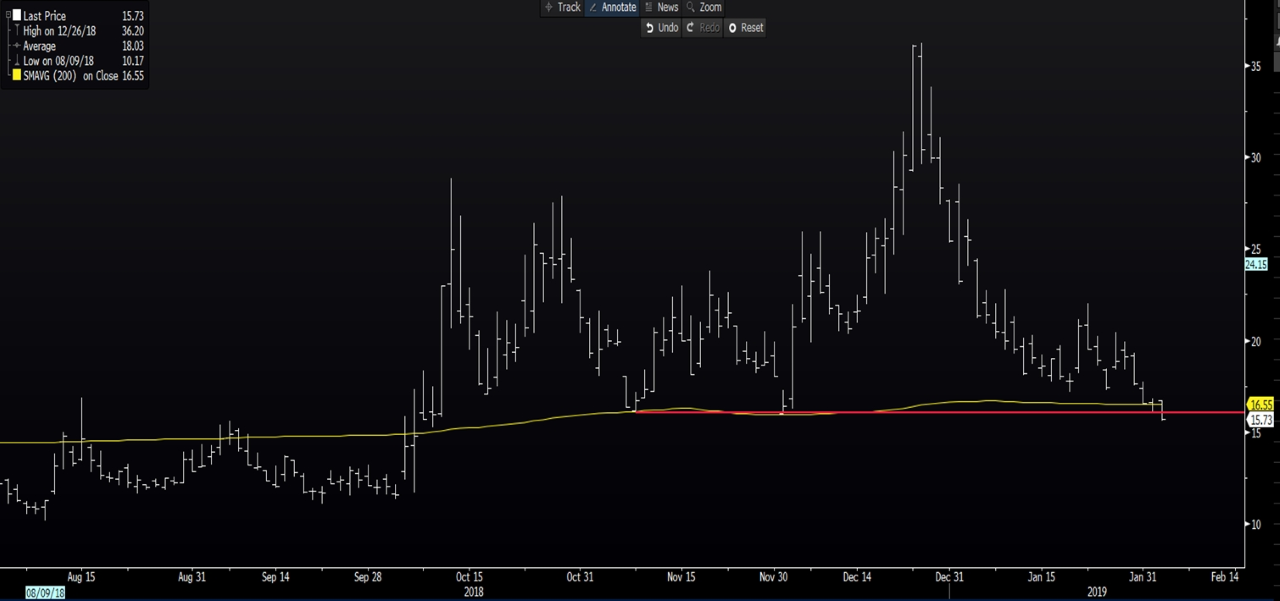
If we look at the implied volatility (vol) of the S&P 500 (or the 'VIX' index), we can see vol has closed below the 200-day MA (the yellow line) and strong horizontal support. If implied vol is falling, then this will attract further capital into the equity market, specifically from vol-targeting funds. If vols are low traders, tend to increase position sizing, perhaps running a tighter stop.
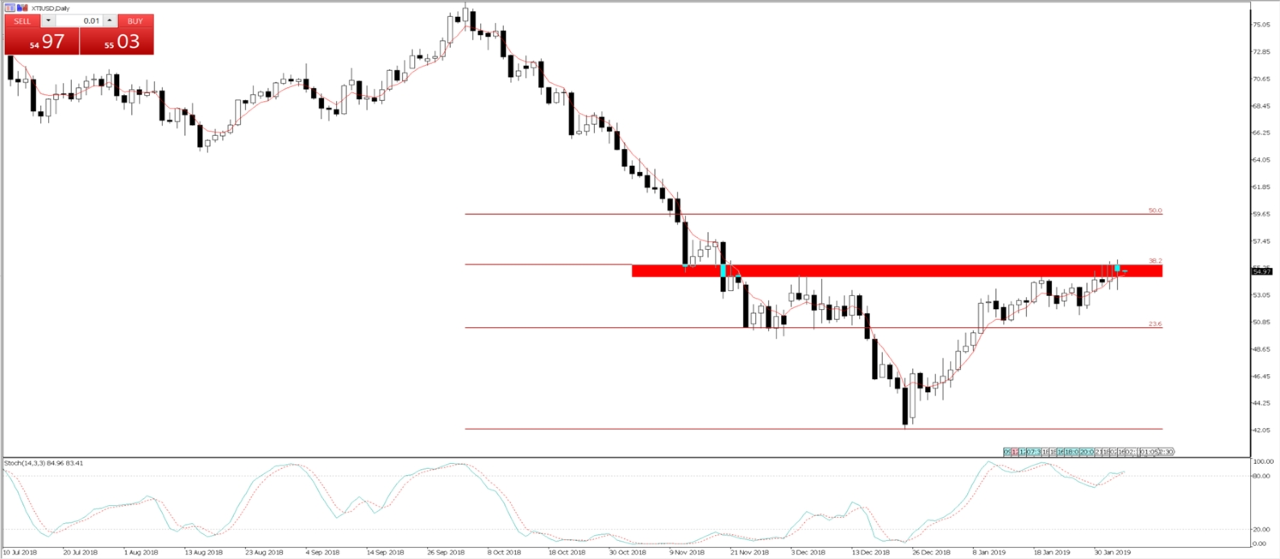
The 38.2% fibo on the US Crude (XTIUSD), which comes in at $55.55, continues to frustrate the bulls. Happy to hold no position at present as price action shows a battle between the bulls and bears that need to be resolved. A close through the red shaded area and I would be long for $59.65. A close through $51.42 (28 January low) would suggest shorts.
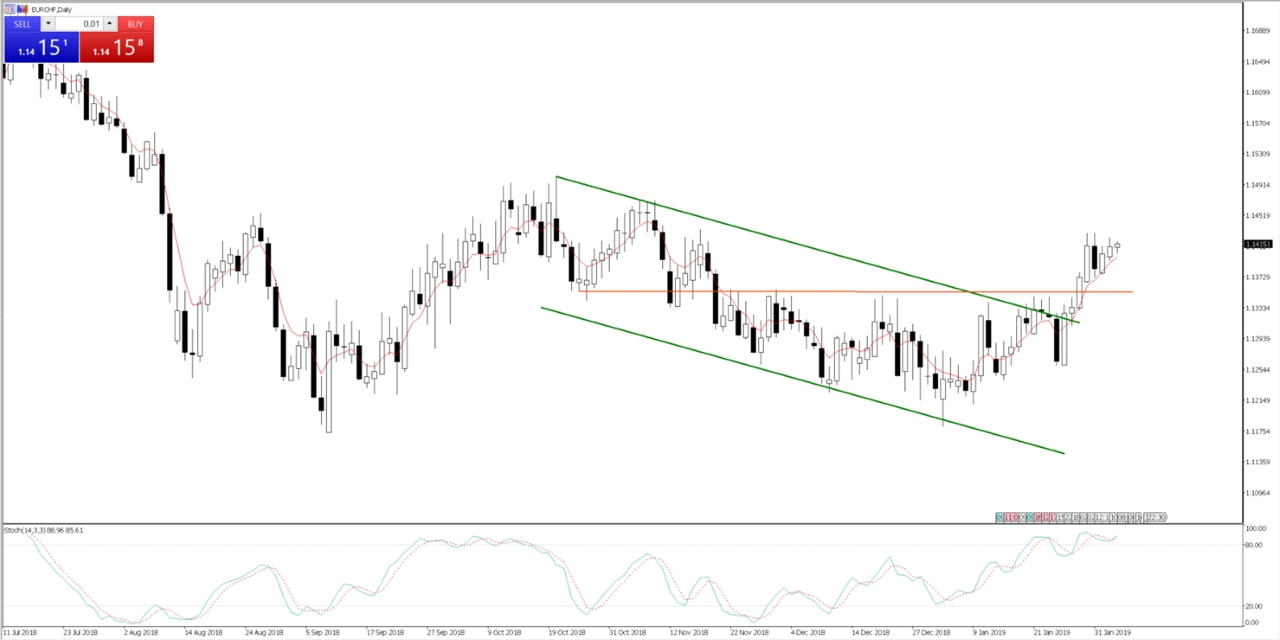
EURCHF – Longs from last week continue to work, and I am enthused by the fact sell-offs in price are contained and supported into the 5-day EMA.
