I’m going to dispense with the usual “the end is near” type schtick and deliberately talk about charts which suggest that a breakout is close and, should it succeed, a powerful rally is imminent. (Secretly, I am hoping to trick the market gods with this post……….shhhhhhhhhhh)
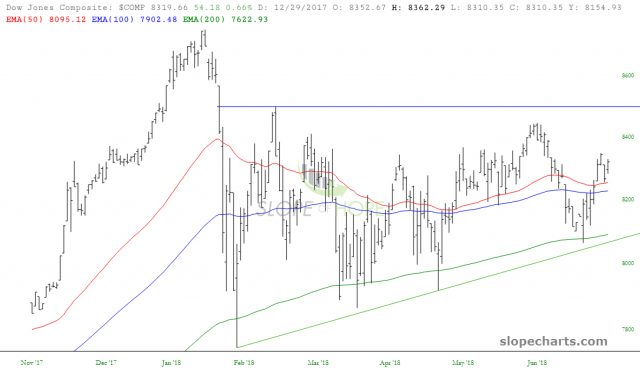
First up is the Dow Composite (also called the Dow 65), which has been painting out a series of higher lows and is approaching a critically-important horizontal level. If it can break this level, I suspect an explosive move higher, sweeping away the lifetime highs from January 2018.
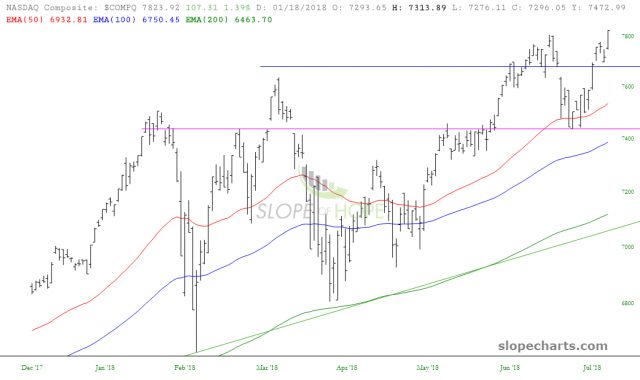
The NASDAQ Composite doesn’t have to “take out” anything. It’s been roaring higher daily, and it’s already reached another never-seen-before high price at yesterday’s close. The moving averages, as you can see, are completely aligned with continued strength.
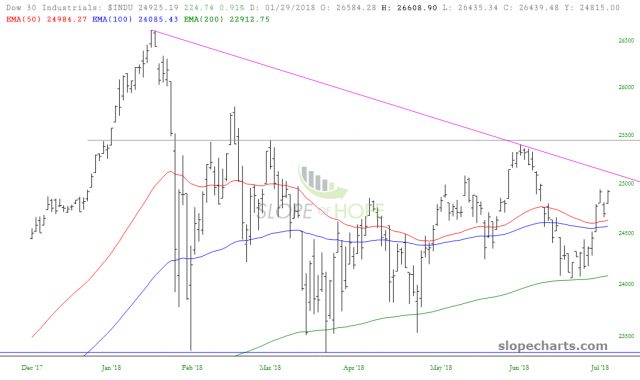
The Dow 30 is one of the weaker large indexes, but the moving averages have not had any negative crossovers, and it would take just one more strong day to break that downtrend I’ve drawn.
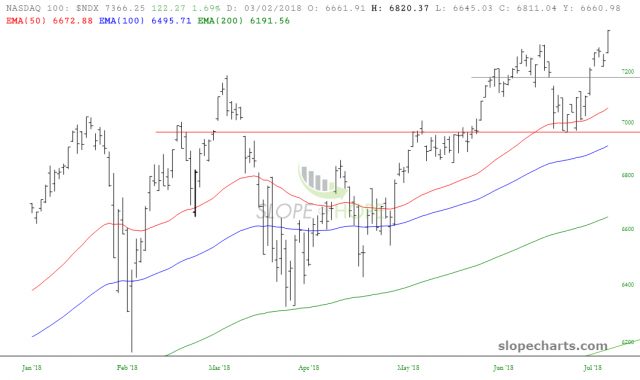
Even stronger than the NASDAQ Composite is the NASDAQ 100, powered by the likes of megacap superstars like Amazon (NASDAQ:AMZN).
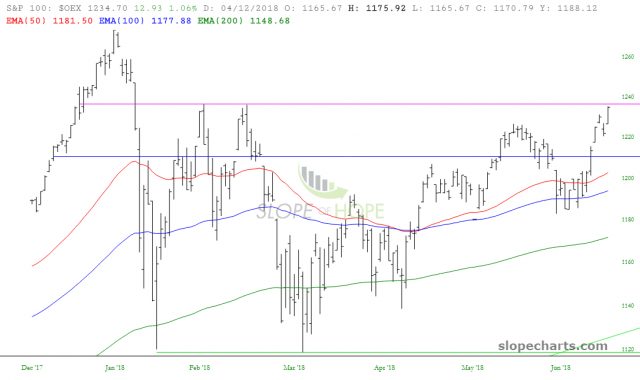
The S&P 100 is just a hair’s breadth away from its own breakout, which would complete a powerful bullish pattern (in the face of a mountain of what normally would be negative market news).
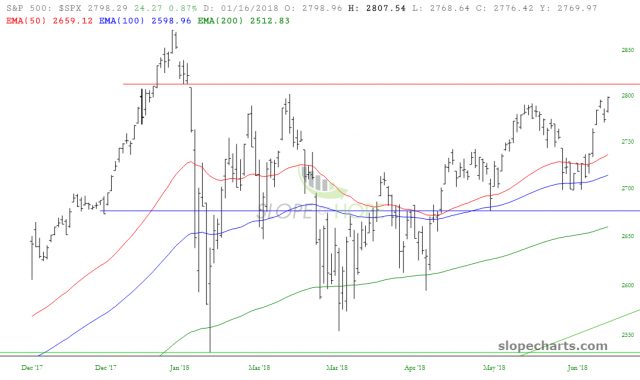
And, finally, the S&P 500 is also close (although not as close as the 100) to its own bullish pattern completion.
Today is supposed to be a very quiet news day, and earning season doesn’t start in earnest for a couple more weeks.

