Some analysts have resorted to rationalizing the stock bubble with never-before-seen valuation measures. To wit, if one ignores the past 12 months (Trailing P/E), and disregards projections for the next 12 months (Forward P/E), the 24-month forward “guestimate” for MSCI All-World companies is suggesting that current stock prices may only be modestly overvalued.
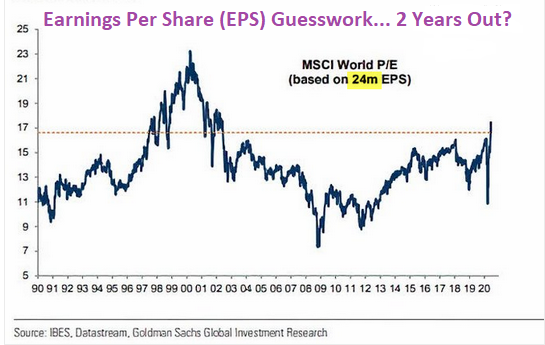
Are you buying this malarkey? Then you may wish to pick up some swamp land in Arkansas.
If investors always chose to look past recessions with unreliable forward earnings projections 24 months out, there would never be any stock declines. A future recovery in profits would always “justify” paying extraordinary premiums in the present.
Indeed, this is the Federal Reserve’s pursuit. Bolster asset prices at all costs so that financial market participants brush aside macro-economic realities and corporate fundamentals.
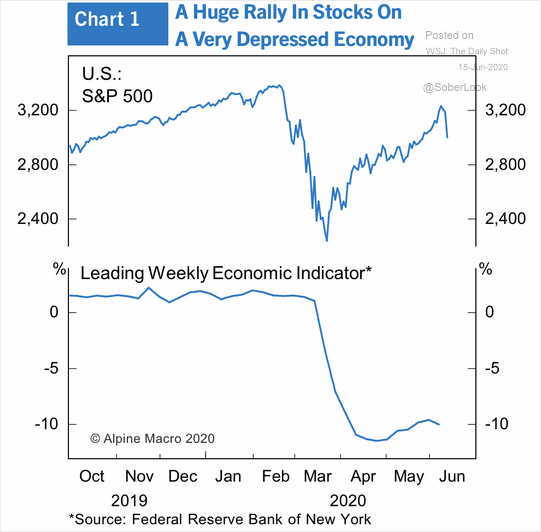
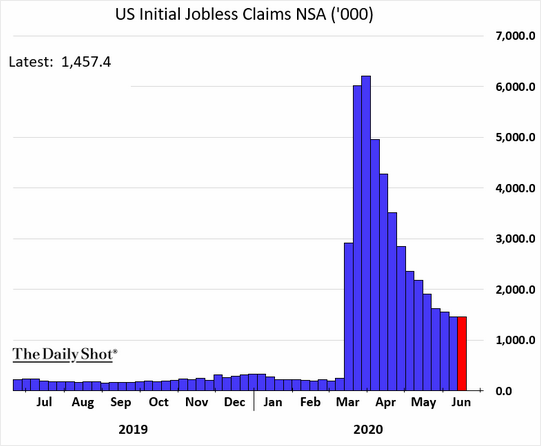
Investment market participants ought to be able to grasp that the job recovery will take more than a year or two to sort itself out. Jobless claims have leveled off at an uncomfortably elevated data point. This likely suggests that millions and millions of positions have been lost permanently.
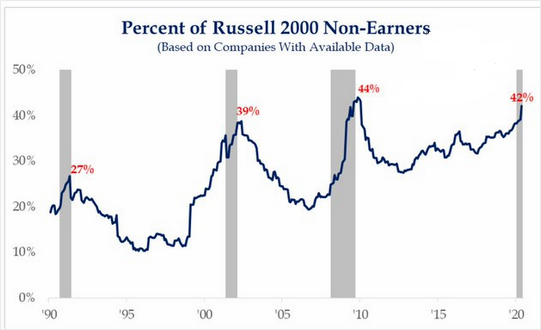
Worse yet, an ungodly percentage of smaller corporations are struggling to make money. And they were struggling before the pandemic.
Meanwhile, public corporations with debt servicing costs that exceed their earnings is approaching 20%. These are dead companies walking.
Does any of this matter? Not to panicky buyers of the NASDAQ Index. Apparently, no price is too high for post-pandemic beneficiaries in e-commerce, e-payment, e-security and e-entertainment.
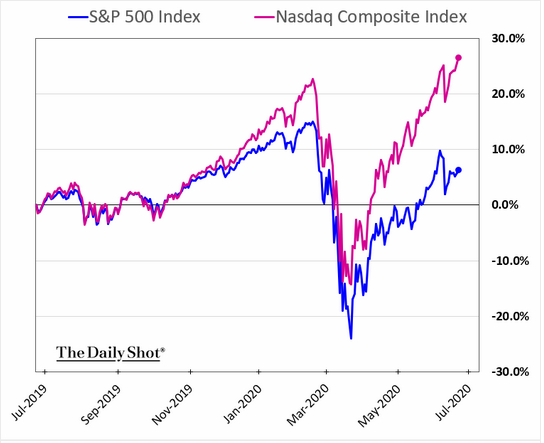
The NASDAQ has dramatically decoupled from the S&P 500 with the relative performance differential reaching 2000 basis points (20%). That is quite the decoupling.
The NASDAQ 100 (QQQ):S&P 500 (SPY) price ratio paints a similar portrait. Clearly, relative outperformance is hitting extremes.
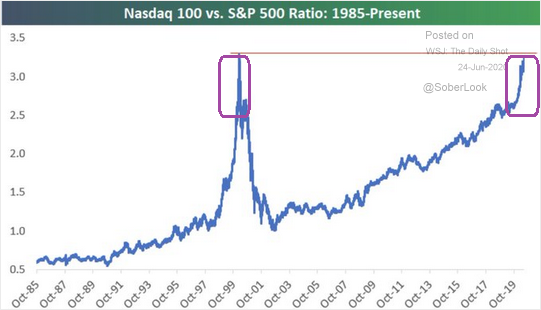
Will the NASDAQ tech train continue to reap the benefit of price agnostic trading? With trillions of Fed dollar liquidity getting into the financial markets, many are betting that the party will last forever.
Of course, many have experienced terrific parties, only to wake up later with painful hangovers. Protecting one’s portfolio during severe hangovers may be more critical than hoping for perpetual records on the NASDAQ.
Granted, the Federal Reserve’s desire to rescue everyone and everything is largely overriding legitimate economic issues (e.g., potential for persistent unemployment, prospect of renewed geopolitical tensions, possibility of coronavirus disruptions, threat of bankruptcy wave, etc.). They’re buying muni bonds. They’re buying junk corporates. If the Fed feels that they need to shore up preferreds, convertibles and/or leveraged loans, something tells me that they’ll get it done.
However, structurally higher unemployment would mean less consumption in the broader economy. And, by extension, companies would find themselves reporting lower earnings for much longer.
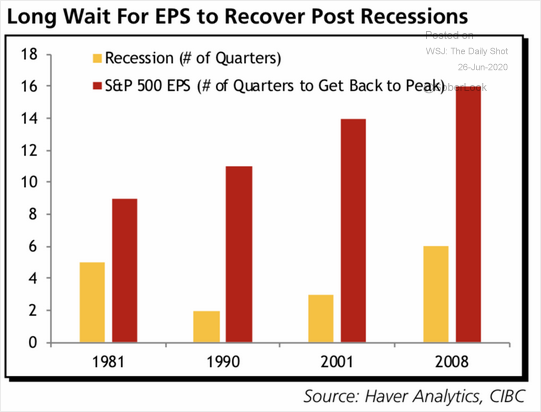
For perspective, each of the previous three recessions—1990, 2001, 2008—had been successively more devastating. Not surprisingly, the deeper the recession, the longer corporations needed to recover earnings per-share (EPS).
It stands to reason, then, the hit to the economy in 2020 will exact a heavier toll than prior recessions exacted on corporate profits. What it also means is that companies would be lucky to see break-even EPS data by 2023-2024.
For the moment, market participants are concluding that earnings and fundamentals are irrelevant. Rather, trillions of electronically printed dollars that the Fed injected into the financial system is chasing a limited supply of public shares, where bond yields are negligible, and money must wind up somewhere. That is the current reality.
Then again, Fed liquidity may have its limitation. All the extra dollars may prefer the safety of cash if severe overvaluation ever comes to the forefront.
There is another possibility. Those American dollars may shift over to foreign corporations with more attractive valuations.
Consider the relative performance differential between U.S. stocks and foreign stocks. How does one even begin to describe it? There are no words for it.
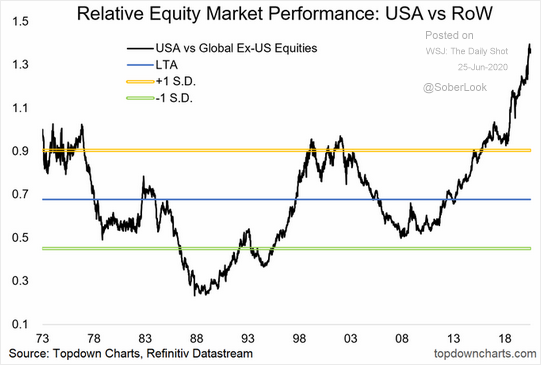
Keep in mind, two of the worst U.S bear markets in history — 1973-1974 and 2000-2002 — occurred when U.S stocks exceeded or approached 1.0 standard deviation in relative out-performance. Now? At 1.4? This is double the long-term average of 0.7.
Despite the potentially compelling case to invest more abroad, the trend since 2011 has yet to reverse course. That is what occurred in 2003, after the conclusion of the 2000-2002 bear market.
I still believe that investors are participating in a stock bear since the February 2020 highs. It follows that our stock allocation for retiree and near-retiree clients is lower than it would be at the start of a new business cycle. That said, we continue to look for thematic and strategic opportunities, regardless of where the corporation may be domiciled.
On the thematic front, “work from home” may have more legs, even if a coronavirus vaccine is developed and distributed. I have been highlighting Logitech (NASDAQ:LOGI) for its pre-pandemic and post-pandemic standing.
Logitech has most of the items you need to work from your residence. Wireless mice, cordless keyboards, premier webcams, smartphone components as well as other accessories for mobile devices – the Switzerland-based company is firing on all cylinders. Indeed, their web site alone tells you just how focused they are on “working from home.”
Another theme worthy of exploring? Fiscal spending on infrastructure. Democrat or Republican control of government, there is going to be a very large push for money to be spent on infrastructure projects. And Tetra Tech (NASDAQ:TTEK) is a top-notch provider of consulting and engineering services.
Tetra Tech even concentrates a large percentage of its operations on government needs via its Government Services Group (GSG). What’s more, many of its valuation measures and balance sheet metrics are reasonably attractive on a relative basis, from a Return on Equity (ROE) of 15% to a price-to-sales (P/S) of 1.3 to a PEG Ratio of 1.5.
Finally, investors might wish to peruse strategic vehicles like Innovator Innovator S&P 500 Power Buffer ETFs, — July (NYSE:PJUL). They seek to track the return of the S&P 500 Price Return Index, up to a predetermined cap, while buffering investors against the first 15% of losses over an annual outcome period.
Here is where it gets interesting, though. You can buy or sell them within the 365-day outcome period if one deems it favorable to do so.
For instance, investors who acquire the Innovator S&P 500 Power Buffer ETF for January (NYSE:PJAN)) right now can achieve a defined outcome over roughly 6 months, not 12 months. PJAN at 27.72 is allowing for 10.6% upside with 11.4% protection against downside losses if held through the end of December.
