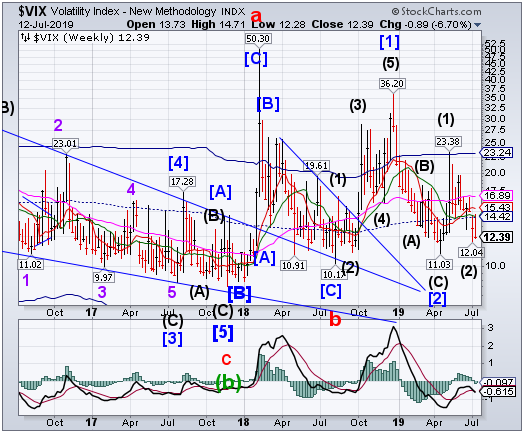
VIX rallied to challenge Intermediate-term resistance and mid-Cycle resistance at 14.42, closing beneath them.However, the decline stalled despite the SPX making new all-time highs. Furthermore, a Master Cycle low was made on July 5, indicting a potential change of trend. A breakout above mid-Cycle/resistance may provide an initial buy signal.
(CNBC) As markets prepare to open for Thursday trade, the SPX (SPY (NYSE:SPY)) looks primed to open above the 3000 mark. Spot VIX sports a 12 handle (a touch below 13), and the US 10Yr (IEF) is looking to distance itself a bit more from its recent foray into the "1's".
...Everything looks peachy from a financial markets standpoint (DIA, QQQ, IWM).
There are a couple warning signs, however, as SPX launches over the 3000 mark.
SPX hits a double trendline resistance. Will they hold?
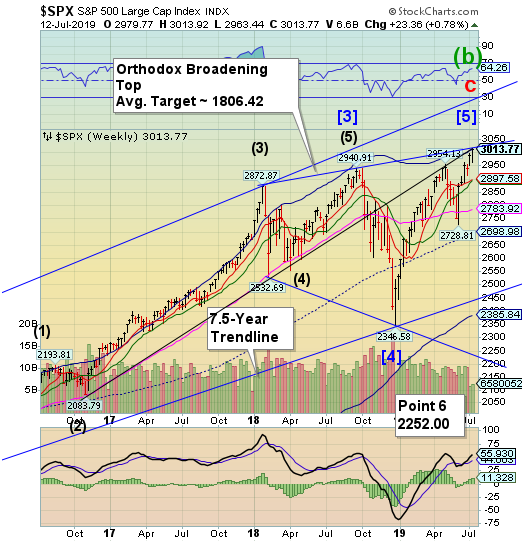
SPX hit both the lower Ending Diagonal trendline and the upper Orthodox Broadening Top trendline at their intersection.Few analysts are familiar with trenline support and resistance, but the evidence of double trendline support is there for all to see on December 26, 2018.A new sell signal may be had at a decline beneath Short-term support at 2897.58.“Point 6” remains beneath the December 26 low.
(Bloomberg) With apologies to Bruce Springsteen, as the Fed prepares to cut interest rates for the first time in a decade, it looks like There Is No Alternative (again!) to U.S. equities. Is the S&P 500's rally to a fresh record a new lease on life or the last gasp before it succumbs to a corporate earnings slide? Two of Bloomberg’s finest, senior markets editor and columnist John Authers and cross-asset reporter Vildana Hajric, join Mike Regan and guest co-host Emily Barrett on this week’s “What Goes Up” podcast to discuss (these matters).
NDX approaches its Cycle Top resistance.
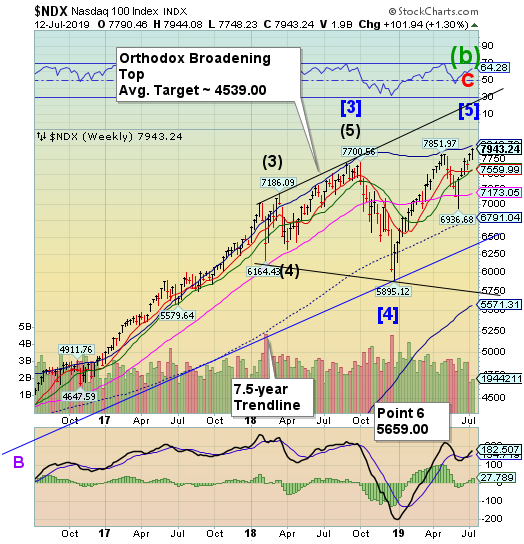
NDX is approaching its Cycle Top resistance at 8010.48. At the same time, the Cycles Model calls for a Master Cycle reversal in the next few days. The combination of price and time may prove to be the mover, even with no catalyst, although there are many potential game changers. Wall Street and the media appear to be “all in.”
(TheStreet) Although most of the FAANG stocks have ripped through the first half of 2019 with outsized gains, analysts at Barclays (LON:BARC) remain largely positive on the group of stocks for the rest of the year.
While the S&P 500 is up 18.5% year-to-date, Facebook (NASDAQ:FB) (FB) is up 51% to $197 a share, Amazon (NASDAQ:AMZN) (AMZN) is up 31% to $1,979 a share, Apple (NASDAQ:AAPL) (AAPL) is up 27% to $200 and Netflix (NASDAQ:NFLX) (NFLX) is up 42% to $382. The only laggard has been Google owner Alphabet (NASDAQ:GOOGL) (GOOGL) , which is up just 7% to $1,120.
Yet Barclays' Ross Sandler wrote in a note Tuesday that "we generally like the backdrop for large cap internet heading into 2Q earnings compared to the prior few prints...Valuations have rebounded a bit but remain well off the previous peak."
High Yield Bond Index ekes out a small gain.
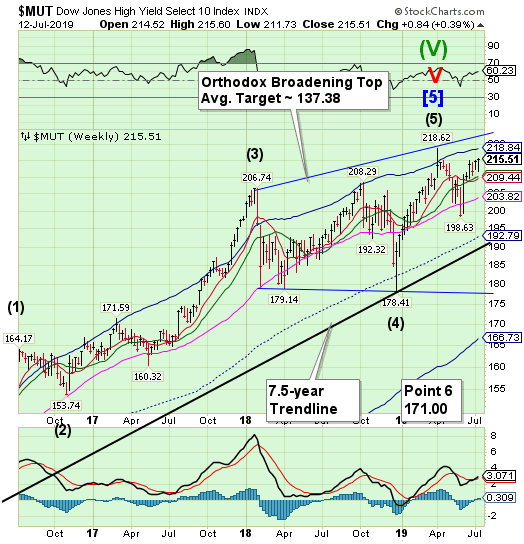
The High Yield Bond Index went higher this week, but no new highs.A decline beneath Intermediate-term support at 210.27 may give a sell signal. The Cycles Model warns the next step down may be a large one.
(ZeroHedge) "There's an art to knowing when to leave the party," warns Pilar Gomez-Bravo, a portfolio manager at MFS Investment Management with $4.5 billion AUM, who sees eerie similarities between the current frenzy for risk and the speculative mania that made her cautious on the eve of the last bubble.
As Bloomberg reports, she's selling junk bonds in a contrarian bet that the debt rally is on its last legs - with the potential to trap funds with billions staked in levered and often illiquid assets - cutting high-yield exposure to 10% from as high as 30% in 2016, in one of her unconstrained funds.
“There’s more risk than reward right now,” she said.
Treasuries repulsed at the Cycle Top.
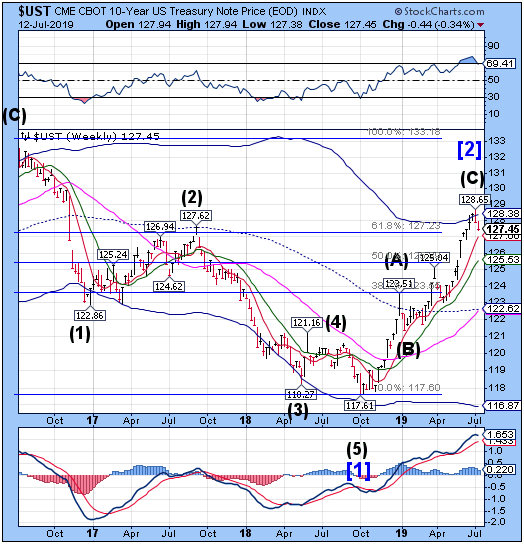
The 10-year Treasury Note Index made its targeted high on July 3 and has been trading lower since then. It declined beneath the Cycle Top resistance at 128.38, giving it a potential aggressive sell signal as predicted two weeks ago.The Cycles Model suggests an important low may be made by the end of July.
(ZeroHedge) There is just one word to describe the just concluded sale of $16 billion in 30-Year Treasury bonds: disastrous.
From top to bottom, today's auction was a shitshow, starting with the high yield of 2.644%, which was not only higher than last month's 2.607%, but it was a whopping 2.6bps tail to the 2.618% When Issued, one of the biggest rails on record.
The bid to cover was also dismal, tumbling from the already low 2.316 to just 2.129, far below the 2.25% 6-auctiona average, and the lowest since November.
The euro falls from Long-term support.
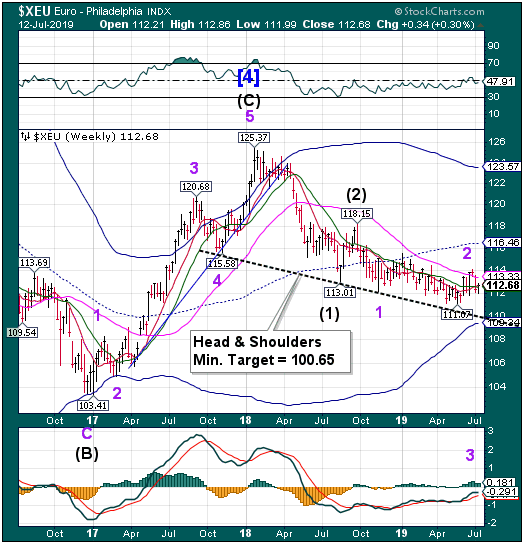
The euro declined beneath Long-term resistance at 113.33 last week.Therewas a bounce this week that closed above Intermediate-term support/resistance at 112.51. A decline beneath that level may produce a sell signal.
(Economist) “He’s almost here...he’s arrived! He’s arrived!” bawls the mayoral candidate, as a sea of blue and white flags declaring Prima L’Italia, Italy First, wave in the summer evening air of the ancient Umbrian hill city of Orvieto. And as the cheers and the shouts of “Mat-te-o! Mat-te-o!” swirl around the medieval buildings, the man the crowd is really here to see walks onto the stage: Matteo Salvini in chinos and an open-neck shirt, sleeves rolled up, slightly tubby, as ordinary-looking as any of the adoring fans jammed into the little square.
They call him Il Capitano. No Italian can fail to hear an echo of Mussolini’s nickname, Il Duce. Critics see neo-fascist overtones everywhere—from the fact that MrSalvini recently published a book using a publishing house with links to a far-right outfit, CasaPound, to the observation that he has been seen in a jacket made by a designer the CasaPoundersfavour. His personality cult, driven by dozens of daily tweets and Facebook posts, expertly crafted to show him as a man of the people, on the side of the little guy against the elite, comes in for similar suspicion.
EuroStoxx reverses from its high.
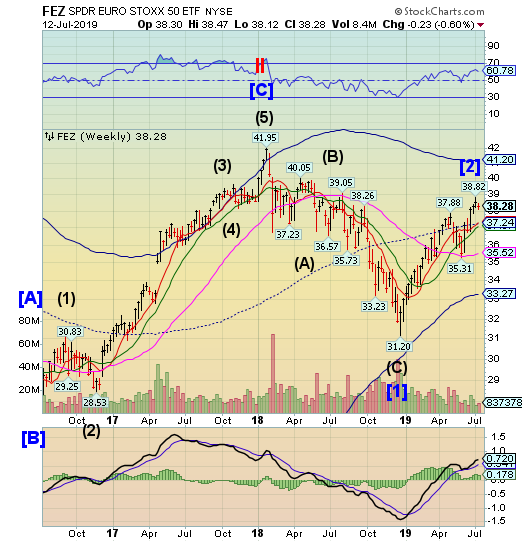
Note: StockCharts.com is not displaying the Euro Stoxx 50 Index at this time.
The EuroStoxx50 SPDR made a new retracement and Master Cycle high on July 3, then reversed.This week it eased lower, but remains above critical support at 37.24.The sell signalmay be triggered beneath the mid-Cycle support. The Cycles Model suggests a probable 2month decline may lie ahead.
(CNBC) European stocks closed flat on Friday as investors reacted to new Chinese trade data and euro zone industrial production figures.
The pan-European Stoxx 600 was in positive territory at the closing bell, chemicals stocks leading the gains with a 1.2% climb while autos recovered from an early fall to trade 0.8% higher. Health care was the worst performing sector, shedding 1.3%.
An official report Friday revealed that China’s exports fell less than expected in June, with dollar-denominated exports falling 1.3% from the same period a year ago. Economists polled by Reuters had expected a 2% decline on the back of the ongoing trade war with the U.S.
.The Yen recovers from its swoon.
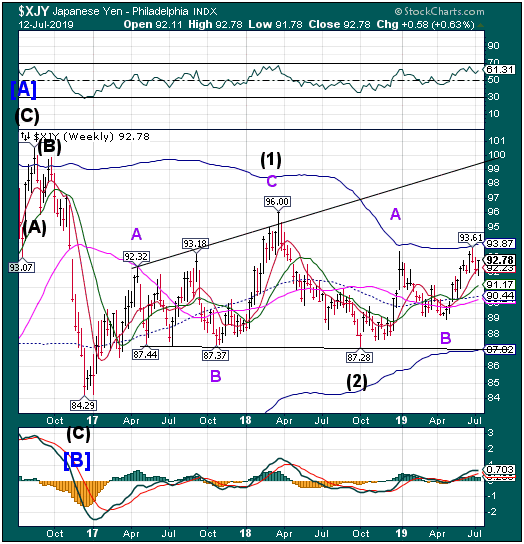
The Yen declined to 91.78 on Wednesday, but recovered the week’s losses. It appears to be on a buy signal.The Cycles Model calls a show of strength through the next week.A breakout may propel the Yen to the upper Broadening trendline.
(Reuters) - The Bank of Japan’s focus on keeping the yen weak and bolstering stock prices has made executives complacent and hurt corporate competitiveness, says a former state banker turned critic of Prime Minister Shinzo Abe’s pro-growth policies.
Akira Kondoh, who led a state-owned bank that funded big infrastructure projects touted as pillars of “Abenomics” stimulus measures, said the program has failed to deliver on corporate reforms and deregulation.
Abenomics only gave people the impression the government was doing something ... but many things remain undelivered,” the former governor of the Japan Bank for International Cooperation (JBIC) told Reuters on Tuesday.
Nikkei hangs on to Long-term support.
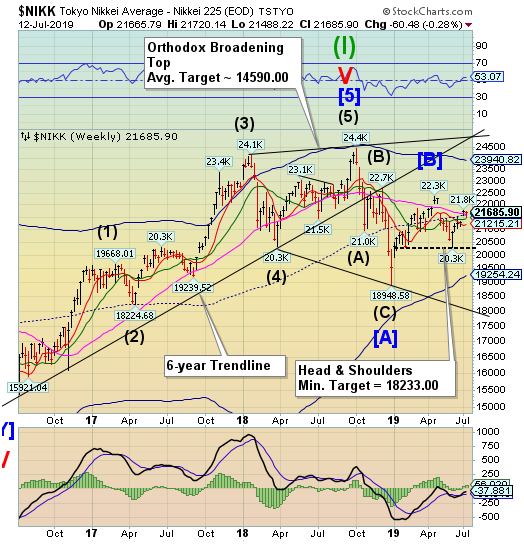
The Nikkei Index declined this week, but closed above Long-term support at 21610.04.This gives the Nikkei the probability of moving higher than the previous high at 21784.22. However, the Master Cycle is stretched and due for an imminent reversal, so the move may happen quickly.
(Investing.com) – The gap in valuations of Japanese shares is at its widest since the dot-com crisis two decades ago and will likely stay that way until global trade tensions ease, analysts say.
The Nikkei share average (N225) has been stuck in a narrow trading range for months but, behind the lull in activity, a major polarization is taking place, analysts say.
"On average, Japanese share valuations are fairly cheap, but when you are stock-picking, many of the shares you would like are already quite expensive," said Hiroyuki Ueno, senior strategist at Sumitomo Mitsui Trust Asset Management.
U.S. Dollar completes its retracement.
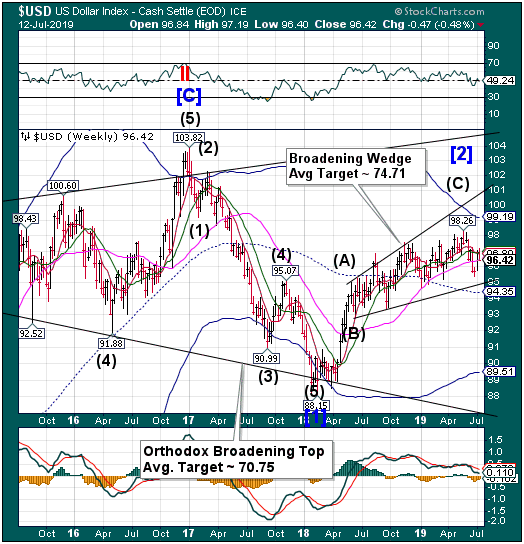
USD appears to have completed a 63.5% retracement of its decline and has rolled over, closing beneath Long-term support at 96.47. This puts the USD on a potential sell signal. Indications show that the decline may continue through the end of the month.
(Reuters) - The dollar fell for a third straight session on Friday, still pressured by expectations the Federal Reserve will start cutting interest rates at a monetary policy meeting later this month.
Against a basket of other currencies .DXY, the dollar fell 0.1% to 97.004, and also posted losses against the yen and Swiss franc.
The dollar briefly trimmed losses after U.S. data showed producer prices rose slightly in June, up 0.1% following a similar gain in May. In the 12 months through June, the PPI rose 1.7%, the smallest gain since January 2017, slowing further from a 1.8% increase in May.
“Evidence of higher inflation will be warmly received by the Fed,” said Joe Manimbo, senior market analyst, at Western Union Business Solutions in New York..
Gold consolidates.
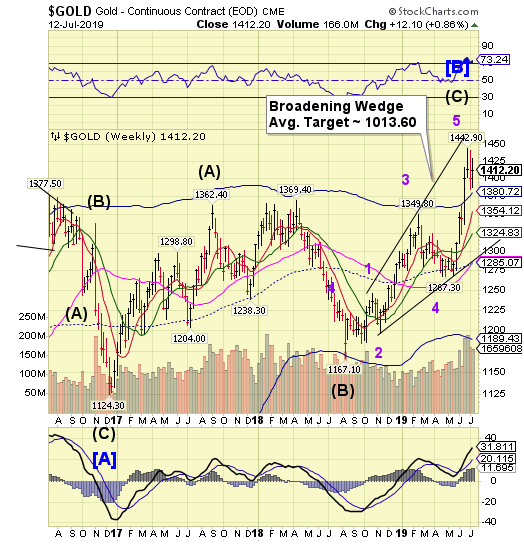
Gold consolidated in an “inside week.”While it may bounce around at this level, the Cycles Model suggests gold may decline for the next two months.The indications are that Gold may join the SPX in its next decline. A breakdown beneath Cycle Top support at 1380.72 may confirm that view.
(NYT) Everywhere, it seems, the world has been steeped in turbulence and strife, and that might seem to be the perfect setting for a major rally in gold, long considered an investment haven.
But the price of gold lately has been surprisingly stable. Despite a surge in June, the price has been largely confined to a range of $1,150 to $1,350 an ounce. And though gold ascended to close the second quarter just over $1,400 an ounce, it was still almost $500 an ounce lower than its peak closing price, reached in 2011.
That may be because of the relative strength of the dollar and of the stock market, which have limited gold’s appeal, market strategists say, but that could easily change and gold may well have its day once again.
Crude breaks through critical resistance.
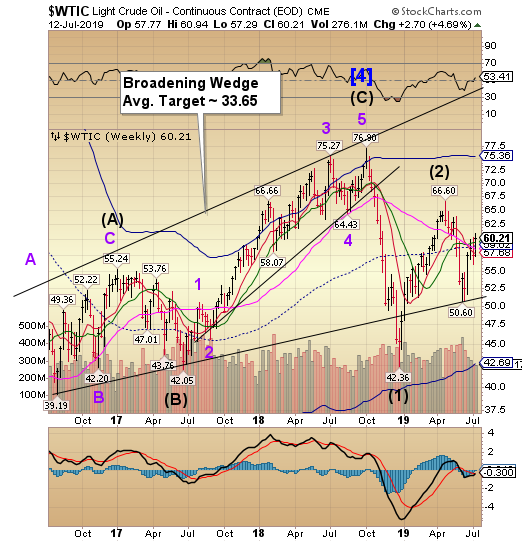
The Crude surged above critical resistance at 57.68-59.55, putting new life in the rally.Strength may persist for another week before the rally deflates.
(MarketRealist) On Thursday, US crude oil active futures fell 0.4% and settled at $60.2 per barrel. Since the closing level last week, US crude oil prices have risen ~5.4% as of 3:09 AM ET today. If US crude oil prices stay the current levels until the end of the trading session, it will be the fifth-highest weekly gain for US crude oil in 2019.
On July 4, the United Kingdom seized an Iranian oil tanker. In response, Iran tried to capture a British tanker. Iran has asked the United Kingdom to release its seized oil tanker immediately. The oil market might be ignoring the tension between Iran and the West. The Brent-WTI spread is just 61 cents above the lowest level in almost a year. Usually, the spread is sensitive to any rise in geopolitical tensions in the Middle East. The significant fall in US crude oil inventories is another crucial factor that might be behind the lower spread.
Agriculture Prices bounce off support.
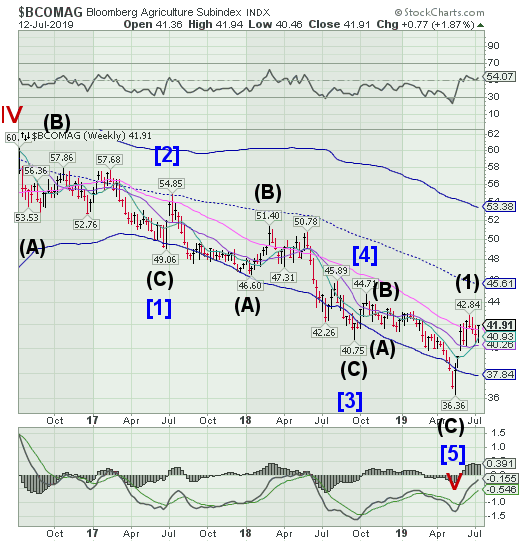
The Bloomberg Agricultural Subindex challenged Short-term support at 40.93, then rallied nicely above Long-term resistance at 41.61. The Master Cycle low came on Tuesday with three strong rally days to follow. The Cycles Model calls for a minimum of two more weeks of rally that may extend until mid-August.
(Bloomberg) Tropical Storm Barry’s dangerous downpours are threatening crops from cotton to sugar, grinding shrimping to a halt and forcing grain elevators to shut.
With as much as 25 inches (64 centimeters) of rain projected for some areas, fields could get flooded at a time when plants are still in development stages. Heavy winds could damage sugar mills in the region and other agriculture facilities. Meanwhile, shrimp fishermen in the Gulf of Mexico are docking ships and tying down equipment, and agribusiness giant Cargill Inc. has shuttered grain-loading operations.
“It’s an emotional drain to say the least,” said fifth-generation Louisiana farmer George LaCour, who raises cotton, sugarcane, corn, wheat, rice and crawfish on 10,000 acres, some of which are in the Morganza Spillway.
Shanghai Index declines to Short-term support.
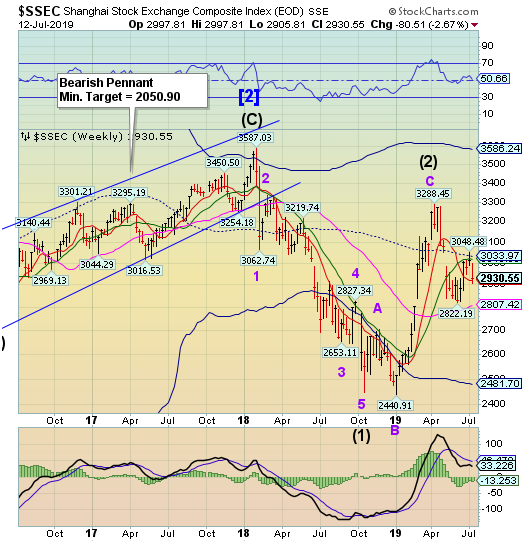
The Shanghai Index was repelled by Intermediate-term resistance at 3018.89, closing lower for the week.TheMaster Cycle high arrived on July 2, setting the stage for a massive decline. The loss of strength may persist through late September.
(ZeroHedge) The latest confirmation that global trade is suffering its gloomiest period since the financial crisis, if not outright depressionary as we pointed out two months ago...
... came overnight from Asia, where first global trade hub Singapore delivered some shockingly bad news about the state of its economy, followed shortly by the latest disappointing Chinese trade report, which showed both imports and exports unexpectedly contracted.
The first warning shot to the global economy came from Singapore, where GDP in the trade-reliant city state declined an annualized 3.4% in the second quarter, a plunge from 3.8% in Q1 and far below the 0.5% consensus estimate. This was also the biggest drop since 2012.
The Banking Index bounces on support.
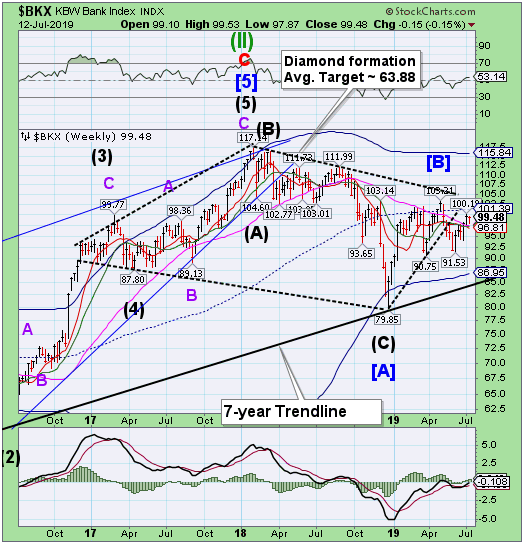
--BKX made its Master Cycle high on July 5 and was not able to reach mid-cycle resistance at 101.39. This week it bounced from Long-term support at 97.36 but stopped short of a new high. This may be the end of the summer rally which usually comes at this time.
(Reuters) - Low interest rates and weak trading volume have pushed down Wall Street’s second-quarter estimates for the biggest U.S. banks, yet investors still say they want in on the sector.
