NVDA Q3 Earnings Alert: Why our AI stock picker is still holding Nvidia stockRead More

S&P 500: The Market Is Through The Worst

Published 09/22/2016, 08:45 AM
Updated 05/14/2017, 06:45 AM
NDX
-
US500
-
IXIC
-

Wednesday, statistically, was said to be the worst performing day of the month, in the worst performing month of the year, for the stock market. What happened? Both the S&P 500 and the Nasdaq 100 rose over 1% and the NASDAQ closed at a new all-time record high. Just like in sports, this is why you play the game on the field. So now that everyone, even President Obama, is breathing a sigh of relief what happens now?

The chart of the S&P 500 below gives some clues. Following the price action, the index broke over long term resistance in July and moved to a new high. Falling just shy of 2200 it then started to pull back.

The pullback retested the break out zone and held. And now it is moving back higher. This broadly created a break of an expanding wedge pattern. The retest, hold and reverse gives solid confirmation of the break out. And now it has a target to the upside over 2400. Yes I wrote that with a straight face.
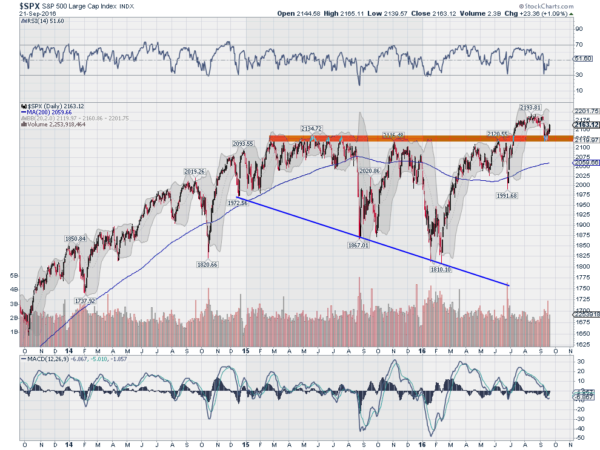
SPX Chart

The S&P 500 will not move there in a straight line, of course. And it never has to get there. The thing is that the price action is showing strength and movement to the upside. Momentum confirms this with the RSI moving back over the mid line as it rises. The MACD has stopped falling and a reversal would add weight to the case for more upside in the S&P 500.

The next major resistance test will come at the prior high, near 2190. Above that level sets a next step to 2390 then 2400. The price and indicators are lining up for more upside in the S&P 500.

DISCLAIMER: The information in this blog post represents my own opinions and does not contain a recommendation for any particular security or investment. I or my affiliates may hold positions or other interests in securities mentioned in the Blog, please see my Disclaimer page for my full disclaimer.

Original post

Latest comments

Loading next article…
Risk Disclosure: Trading in financial instruments and/or cryptocurrencies involves high risks including the risk of losing some, or all, of your investment amount, and may not be suitable for all investors. Prices of cryptocurrencies are extremely volatile and may be affected by external factors such as financial, regulatory or political events. Trading on margin increases the financial risks.
Before deciding to trade in financial instrument or cryptocurrencies you should be fully informed of the risks and costs associated with trading the financial markets, carefully consider your investment objectives, level of experience, and risk appetite, and seek professional advice where needed.
Fusion Media would like to remind you that the data contained in this website is not necessarily real-time nor accurate. The data and prices on the website are not necessarily provided by any market or exchange, but may be provided by market makers, and so prices may not be accurate and may differ from the actual price at any given market, meaning prices are indicative and not appropriate for trading purposes. Fusion Media and any provider of the data contained in this website will not accept liability for any loss or damage as a result of your trading, or your reliance on the information contained within this website.
It is prohibited to use, store, reproduce, display, modify, transmit or distribute the data contained in this website without the explicit prior written permission of Fusion Media and/or the data provider. All intellectual property rights are reserved by the providers and/or the exchange providing the data contained in this website.
Fusion Media may be compensated by the advertisers that appear on the website, based on your interaction with the advertisements or advertisers.
© 2007-2024 - Fusion Media Limited. All Rights Reserved.