It’s onwards and upwards for US stocks and the leads are once again constructive for broad Asian equity appreciation.
The Teflon market continues in earnest and nothing sticks and very little is of concern, as has been the case for some time with the same macro factors keeping the positive trend in play. Synchronised global growth has been in the mix for some time, with the IMF now joining the party and raising its view on global growth for 2018 and 2019 to 3.9%. Of course, markets have been dissecting fiscal support for months, although the new focal point is around colour on Trump's infrastructure plans and there has been further speculation on how funds will be deployed. Improving corporate earnings has also been a theme, while developed market central banks are mostly behind the curve and again this is supportive of ever easier financial conditions and supportive of the grind higher in US stocks and we see the S&P 500 up a further 0.5% higher, with good flows into all sectors bar materials (currently 0.4% lower), with 64% of stocks higher on the day.
One can be somewhat enthused that we have seen a short-term agreement to fund the US government through to 8 February, with Senate Democrats seemingly compromising on a vote on the DREAM Act in the coming weeks. An extension into early February is hardly going to get pulses racing as investors want a long-term solution and it puts the next phase of debate and negotiations ever closer to a much-needed vote to raise the debt ceiling with the US Treasury Department expected to exhaust funds to pay any coupons and maturing debt in early March. So February could be a big month for markets and it will be filled with political headlines to drive.
The reaction to the compromise and where non-essential government workers will, at least for a brief period, resumes normal operations was a slight rally in the USD, but it was hardly emphathic. US Treasuries were finding modest buyers, but the news has seen yields moving back to the flat line and we see the 10-year Treasury currently at 2.65%. Inflation expectations, as measured in the US 5Y ‘breakevens’ have not budged and remain at an elevated 2.15%, so US fixed income markets have been fairly sanguine on the day, as has credit, where high yield credit spreads are basically unchanged. S&P 500 implied volatility, as measured by the ‘VIX’ index, is a touch lower and poised to break 11%. However, there have been some life in US interest rate markets, with eurodollar futures finding a further repricing of future rate expectations and we can see the yield differential between March 2020 and March 2018 widening four basis points (bp) to 80bp, with expectations firming for increased moves in 2019.
So, US rates markets continue to firm, and therefore it’s interesting that the USD hasn’t really followed suit, notably with the ECB meeting this Thursday (at 23:45 aedt) and an elevated risk the bank are less hawkish than what is expected. GBP has seen the bigger percentage move in G10 FX on the day (gaining 0.7% against the USD), but its EUR/USD that is of keen interest and the fact it refuses to head below $1.22, although I really want to see a close below the 17 January low (and bearish outside day) of $1.2165 to feel a deeper correction is to play out, from what is an extended EUR long position. Of course, it’s the BoJ that wrestle back the limelight today, where there will be a focus on any narrative that pushes back on the notion they are looking to alter its Yield Curve Control plans later this year. For those bearish USD/JPY, I feel the risk is we can look to sell at higher levels here and would be fading moves into ¥111.50 in the short-term.
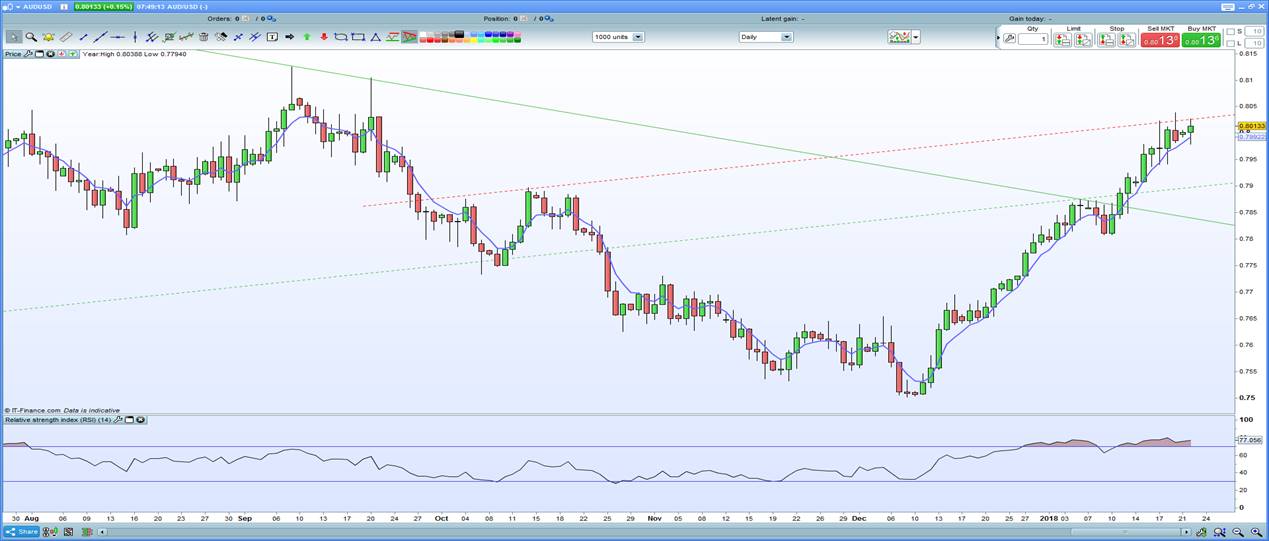
AUD/USD traded to a low of $0.7978, and like EUR/USD has diverged from interest rate differentials, which argue the pair should probably be trading closer to 79c. That said, the current price is testing trend resistance on the daily chart into $0.8030 and this should cap any further gains through Asia, although it’s hard to be short at this juncture with any conviction, as price action just isn’t there…yet. There is a lack of catalysts through trade today, although the BoJ could influence other developed market fixed income markets, which could have an influence on the USD, so one to watch, although as per usual there is no set time for the Japanese central bank meeting.

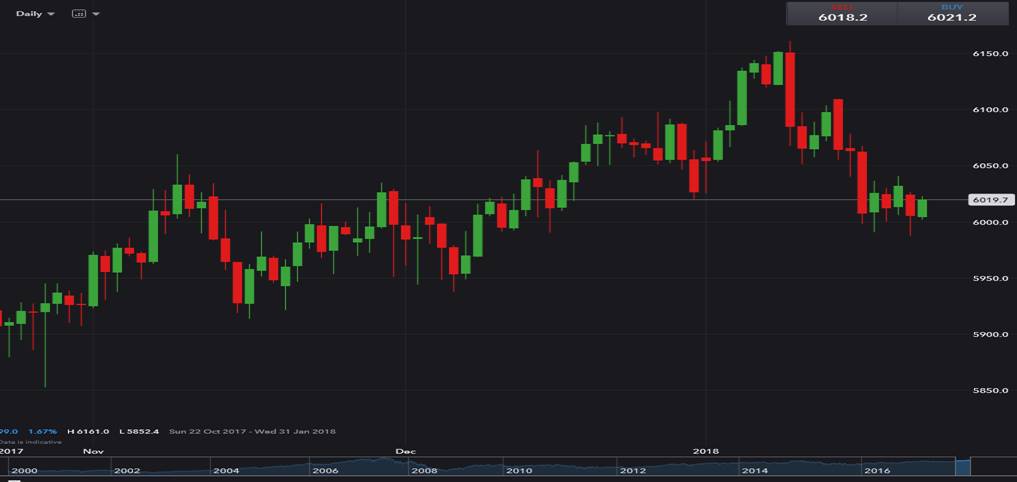
In equity land, Aussie SPI futures sit now reside at 5964, thus sitting up 26-points and our opening call for the ASX 200 is seen at 6019. Looking at the daily chart we can see clear consolidation after ASX 200 fell from 6150 into 6000 (from 10 January to 17 January) and one has to ask if this is the consolidation before a leg lower or is a base being formed and the platform set for better days. It’s hard to be bullish the ASX 200 until we see a sustained move through 6040, so it wouldn’t surprise to see traders fade the open and the Aussie market grind a touch lower, although financials, which took out 16.6 points from the index yesterday should see a more positive open, with CBAs ADR suggesting the stock opens 0.4% higher.
Based on its ADR, BHP is eyeing a flat open, although if we head in the same vein as the S&P 500 then materials face headwinds today and we can see spot iron ore -0.2%, while iron ore futures are 1% lower. Copper is up 0.5%, while US crude is up a touch, which doesn’t necessarily explain why the S&P 500 energy sector has rallied 1.7% and could be indicative of a stronger open for Aussie energy plays.
For those wanting to express a bullish view on global equities, one is far better off buying the strongest markets and that means using the NASDAQ, Hang Seng, H-Shares or China A50 cash, where these markets are trending beautifully.

