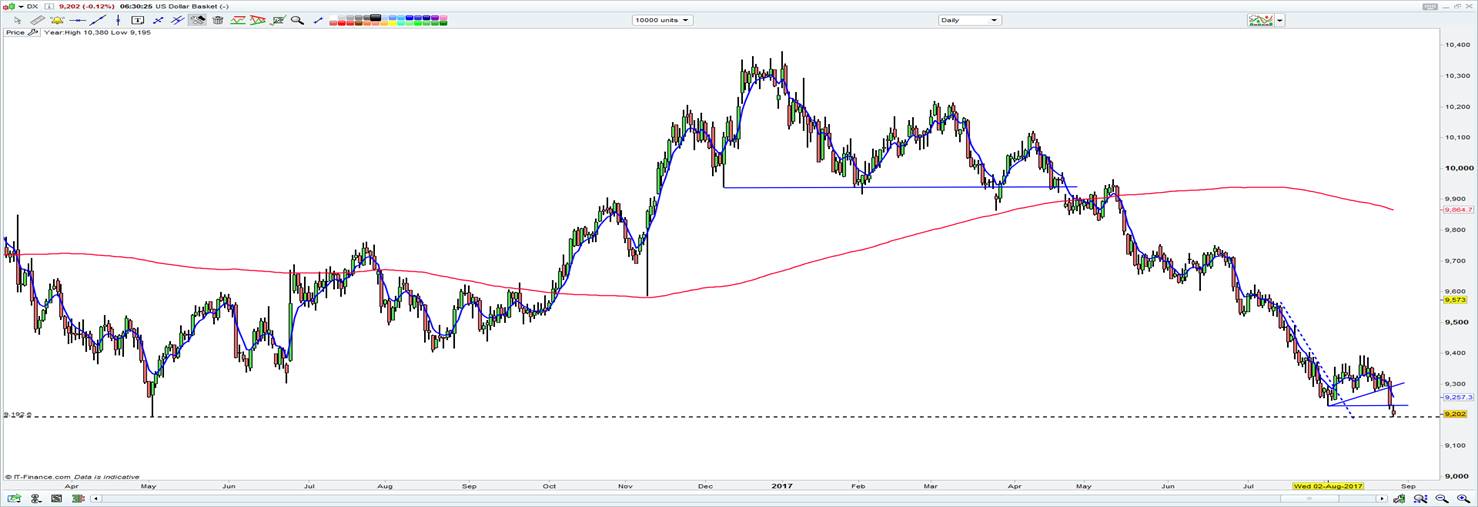
The USD continues to find no love in this market, with the USD index lower by 0.5% and trending strongly to the downside. We have seen technical support kicking in at the 3 May 2016 spike low, but when you see a daily chart like that of the USD index one really should only be either short or neutral, but buying now seems such a low probability trade.

We haven’t really seen much of a move in fixed income, which would naturally be the usual backbone behind moves in the currency markets, but we can see the US 10-year treasury little changed at 2.16% and there has been no movement in the yield curve. There is not a lot of news on the political front, aside from scuttlebutt that Secretary of State, Rex Tillerson, is likely to be the next White House employee to potentially vacate his position, so don’t be surprised if we hear of his departure soon.
We also know Trump is on the road trying to sell his tax reform, although what this plan actually looks like is not truly known and we are sceptical of getting much colour other than Trump feels the US economy needs tax reform more than ever and he is working tirelessly to achieve it.
I also sense a market that is still trying to get to grips with a Gary Cohn as a leading candidate for the Fed chair in 2018. So a Gary Cohn/Donald Trump partnership, driving monetary and fiscal policy in the US economy is a dynamic that markets are trying to discount. Janet Yellen was seen as a dove amid the Federal Reserve, and if she doesn’t get re-appointed then it’s because she would be partially down to her raising rates too aggressively in the eyes of Trump.
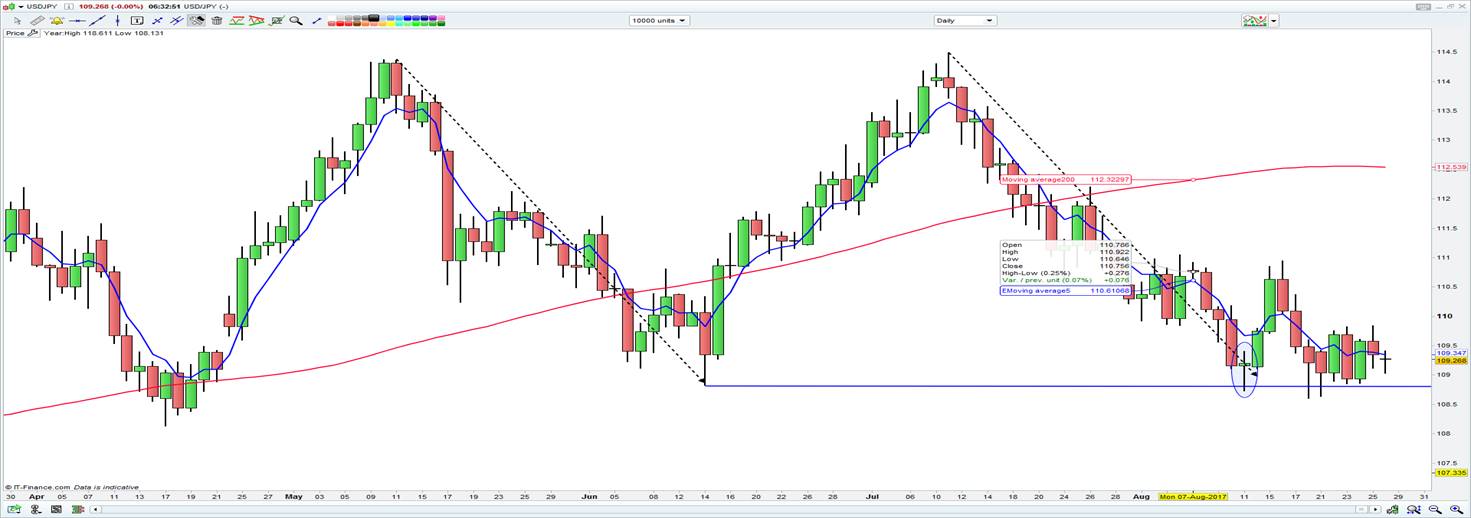
EUR/USD is performing strongly, with the pair reaching $1.1984 and $1.2000 is just a whisker away. USD/JPY needs close monitoring too, and a firm break of ¥108.82 would be significant, as the 14 June low (and bottom of the Ichimoku cloud on the weekly chart) has been a floor in the pair for months now. AUD/USD traded into $0.7973 and eyeing a move into 80c and the focus turns to building approvals (consensus -5% in July) and Q2 construction work (+1%), with both data points out at 11:30 aest.

There is also a lot of focus on USD/CNH and USD/CNY, with both currency pairs in free-fall at present. Happy to stay short USD/CNH as a trade and just as Mario Draghi has given us a buy signal in EUR by failing to show concern around the recent EUR moves, the PboC seem quite comfortable with CNY strength too.
On the session we haven’t seen too much of a move lower in USD/JPY, however, gold has been well traded and has smashed through the $1295/96 double top with vigour. We are seeing the daily close through this level, which is key and while moves in US ‘real’ (inflation-adjusted) bond yields and USD/JPY are still the main drivers, one can’t help but be enthused by what they are seeing in price action and the technical set-up. Silver, even more so. The bulls are in firm control, so a close through ¥108.82 (in USD/JPY) and gold could be trading closer to $1350. Aussie gold stocks look like a good place to be today.
We can’t say the same thing for oil companies, with US crude -2.5%, with Hurricane Harvey, causing widespread devastation and there seems no let up, with Houston Harris County expected to see between 16 to 24 inches in additional rainfall over the next few days. The demand side of oil equilibrium comes into balance here and traders feel there is going to be subdued demand for crude given the level of refinery shutdowns we are seeing in the Gulf. Of course, the shut downs have been great for the gasoline price and we can see gasoline futures flying.
On a more positive note and hidden behind the news surrounding Hurricane Harvey we have seen reports that Saudi’s and Russia are looking to extend the current production agreement for a further three months and into June 2018.
Staying in the commodity theme and we can see another solid nights trade for copper (+1%) and while spot iron ore closed 2.1% lower, we can see some buying coming back into iron ore futures, which suggests the spot price could gain when its fixed later today.
In other leads for Asia, we can see some outperformance from US small caps, relative to large caps, with the Russell 2000/S&P 500 ratio moving a touch higher. Both US indices markets have etched out small gains, with healthcare the outperformer within the various sectors and that won’t really benefit the ASX 200.
Gold stocks are predictably flying (the GDX (NYSE:GDX) ETF – gold miners ETF is up 3.6%), while the energy sector is lower by 0.4%. Financials are finding few buyers and we can see the XLF ETF (US financial sector ETF) lower by 0.6% and the worst performer of the sectors. Corporate credit has not really provided any inspiration to equity traders either, with investment grade credit index three basis points wider.
SPI futures have traded a range of 5697 to 5666 in the night session, but ultimately the Aussie futures index is trading either points higher at 5684 from the official ASX 200 close at 16:10 aest. Our opening call for the ASX 200 sits at 5715 and the moves seem capped and confined to a 5696 to 5760 intra-day range today.
Keep an eye on China as well, as markets like the CSI 300, A50 Futures and H-shares are flying and showing the strongest risk-adjusted moves in any equity markets. The feeling on the trading floors in China seems highly bullish.
