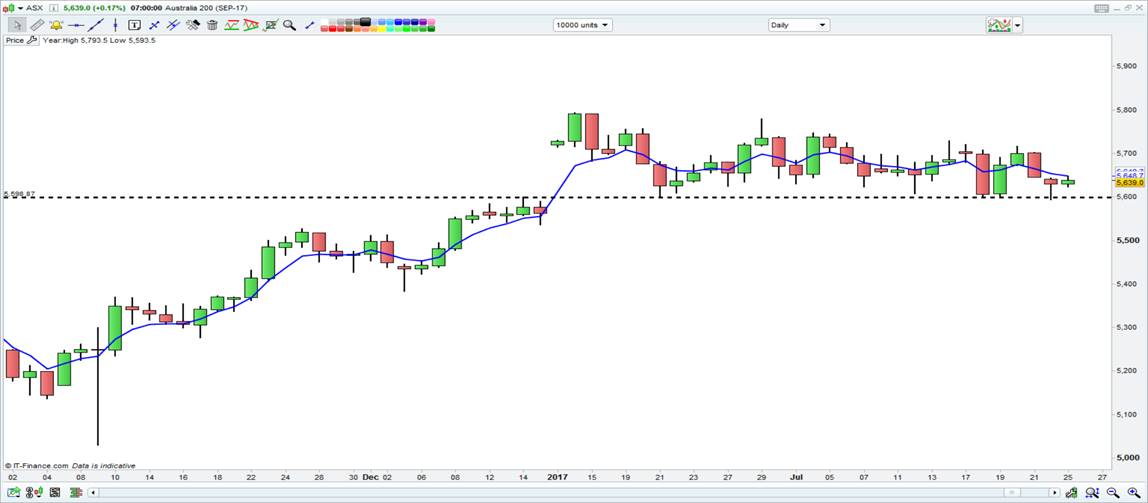
One of the developments I took out of yesterday’s session was the fact SPI futures drove the ASX 200 higher through afternoon trade. This was interesting in itself as futures traders once again confirmed 5600 as key support in the futures index and the fifth time the index has bounced off this figure since late June, which in this instance took the ASX 200 higher into 5688.
In the night session, we have seen SPI futures build on this support, hitting a high of 5647, although currently sits lower at 5638 (+13). 5600 still remains the line in the sand for me and a close through here (on a daily and more so weekly basis), should be the grounds for a deeper pullback in the Aussie equity markets. Keep in mind that SPI futures were trading at 5626 at 16:10 aest, and currently sit at 5639, so it won’t surprise then to see the ASX 200 also being called to open just shy of 5700.

In terms of leads, US equity markets have held in well here, in fact, the NASDAQ has put on 0.36% and moved to new highs ahead of a big week of tech earnings. Specifically on this index, I want to see Fridays low hold, which it has, so on the day we have made a higher low and a higher high and with the index at all-time highs long positions are clearly the preference, although the market has not liked the numbers from Alphabet (NASDAQ:GOOGL) and it causing futures to sell-off in the after-hours, so I would be keeping a stop loss on the trade just below 5890.
The S&P 500 has done little on the day (closing down 0.11%), although it is modestly bullish that price held Fridays low, although unlike the NASDAQ 100 couldn’t quite print a new high
This lack of market move won’t surprise too greatly, and one just has to look at implied volatility in the S&P 500 (a.k.a the “VIX” index), which is trading at 9.43% and building on Fridays close, which was the lowest since 1993. Traders are just super content with the world they live in right now, or at least programmed to sell volatility!
Perhaps the same bullish structure can’t be said for European equities which need close attention. The German DAX has been looking vulnerable really since mid-July and although the index closed down 0.3%, the bulls have stepped in and driven price nicely off the lows, with proceedings looking quite ugly in early European trade. As a trade, I would be watching European equities like a hawk as today’s candle (on the daily chart) suggests exhaustion from the sellers and a higher high in price in the upcoming session could argue a case that the lows have been seen. This could mean rotating out of the S&P 500 and into select European markets as a short-term trade, however, the technicals are not quite there.
I would also suggest this a function of FX moves, as European equity traders have firmly taken notice of the rally in the trade-weighted EUR and made a case that this will impact earnings for those corporates with an elevated level of offshore earnings. Just look at the German automakers, which have been impacted by the rally in EUR/CNY and EUR/CNH, with Chinese importers losing purchasing power.
We do, therefore, need to keep an eye on the EUR, as modest selling has come into EUR/USD and the EUR crosses. There’s perhaps not enough to suggest aggressive mean reversion short positions, but enough for traders to assess the risks of holding longs here, and let’s not forget tomorrow's FOMC meeting could actually surprise and catch a market very long of EUR/USD and bearish the USD all round.
Of course, in the same vein that the EUR strength has hurt European equities the 8% of so sell-off in the USD has been a tailwind for US equities and should almost certainly play into corporate earnings into Q3 and more so Q4 earnings. It has also been good for US inflation expectations, which played into the recent move lower in ‘real’ bond yields and higher gold prices.
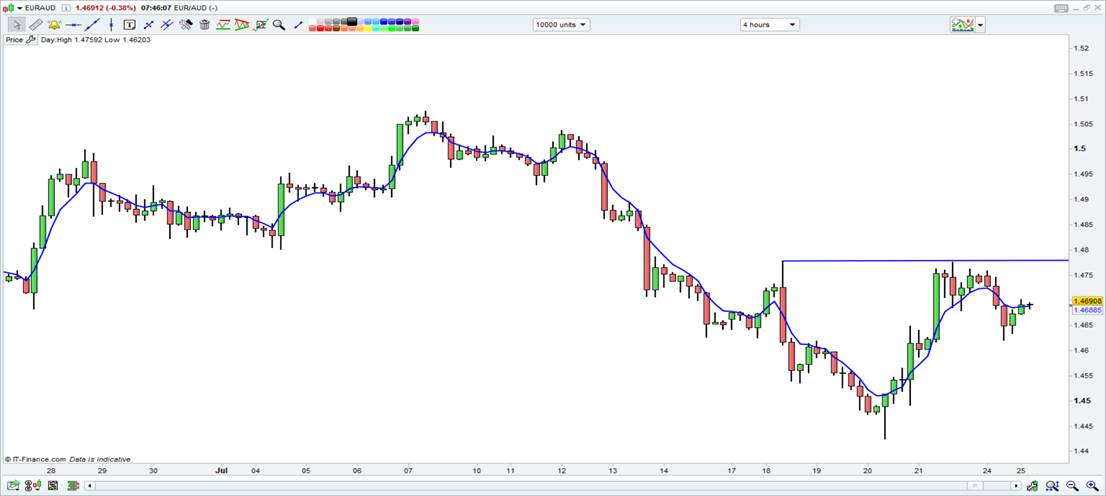
EUR/AUD has been a trade I have had on the radar, and specifically, I wanted to see a close above a$1.4777 (the July double top) before taking out long positions, and that remains on the watch list ahead of tomorrow’s Q2 CPI and speech from the RBA governor.

Staying on the FX theme and AUD/USD saw a nice move into $0.7967 in European trade, but sellers have faded this move, with price now sitting at $0.7924. The bids on Friday came in at $0.7875, so this level needs to hold in the short-term and a move through here could attract some attention. Aside from traders pre-positioning portfolios and adjusting for the event risk on Wednesday, we have seen support come in from a 1.1% rally in spot iron ore, while Dalian iron ore futures have seen a nice rally too.
Oil has been a talking point on the floors too, with US crude closing up 1.4% at $46.40. The focus has been on the Saudi’s who have detailed they are limiting exports to 6.6 million barrels a day in August. However, the comments from Halliburton (NYSE:HAL) that US explorers are “tapping the breaks” seem important and come at a time when the US oil rig count fell by one rig last week and looks like it is topping. As we know the variance explained in the oil move is one largely down to supply and specifically the US shale gas operation.
If the rig count does start to fall and we can see crude trade through supply (and the July double top) of $47.51 to $47.73 then I would be a buyer of oil and energy stocks as price would like move into $50 fairly quickly.
