It’s tough to be anything else other than bullish on risk assets at the moment and while implied volatility is extremely low global equity markets continue to creep higher.
The mood on the street still doesn’t feel overly bullish in any way, but look around the markets and we see new highs in the FTSE 100, DAX, S&P 500, Nasdaq 100 and a new high in the MSCI World index should be in play this week. Emerging markets (EM) are flying too and attracting heavy inflows into equity and bond funds, while we are also seeing strong moves in the likes of the Mexican peso (+10.8% ytd), Polish zloty (+9.5%), Russian ruble (+8.7%) and Korea won (+7.5%).
The EEM ETF (iShares MSCI Emerging Markets ETF (NYSE:EEM)) has highlighted this goodwill towards all things EM, gaining a further 1% overnight and rallying for a fifth straight day, despite the trend being mature stay long this market. We can see the Nifty 50 in India looking like a trend followers dream and trading at all-time highs, while in China we can see a bullish set-up in the Hang Seng (the highest levels since July 2015) and H Shares. It seems like an offshore move though and while the CSI 300 index still has had a reasonable rebound, there is some work to do.
I’d be long any of those markets here, but the H-Shares especially looks compelling given the strong upside break through the April and May double bottom neckline and the technical target here is 10,800. Place a stop below yesterday’s low of 10,336 and we still have a 2:1 risk-to-reward.

We could explore other markets, but the point is there is great opportunity in global markets. These trending conditions are clearly not occurring in Australia and if traders are simply restricting themselves to the Aussie market they are missing out on generating increased returns for the portfolio. Saying that the ASX 200 is simply moving sideways, and best highlighted by the 20-day moving average, and therefore tactically we can range trade this market. Play a 5957 to 5791 range for the foreseeable future.
Given all the leads we can see SPI futures pushing up 17 points, but recall this change is taken from the start of the night session at 17:10 aest and given SPI futures fell a touch between 16:10 (the close of the ASX cash market) and 16:30 AEST (the close of the futures day session) we actually see the ASX 200 cash market opening unchanged at 5837.
Clearly the big talking point yesterday was the punchy moves in the barrel courtesy of a determined and cohesive stance from the Saudi’s and Russian’s about extending the output cuts for a further nine months. The market is always going to react when we see collusion between these two oil heavyweights, especially when they pull out a famous Mario Draghi line and pledge “to do whatever it takes” to bring down global inventories.
We have, however, seen oil come off the session highs of $49.66, and while we can look at the fact crude is up 2% on the session, we should remember that much of this gain was priced in yesterday and crude is actually unchanged from the close of the ASX 200 cash close.
Trading in oil remains a client favourite and there has been a healthy scepticism and a propensity to sell into the move into $50 barrel. Importantly the market has discounted a new concerted agreement at the 25 May OPEC meeting in Vienna and new news has to be seen to push crude convincingly above $50. When you hear that some of the biggest US shale producers have breakeven rates at $20 (although the total breakeven rates are closer to $60) there seems one clear winner from the moves from Russia and OPEC.
If we take BHP’s American Depository Receipt (ADR) we see the stock opening around 1% high and just above the $24 level. Vale’s US-listing has flown 3%, so this could signal brighter days for materials more broadly and if we truly are seeing a global synchronised growth story and perhaps the negativity towards China of late is overblown then the materials space could play some much-needed catch up. It’s not been a great place to be invested in 2017, with the materials sector -1.56%, only eclipsed by the telco’s space.
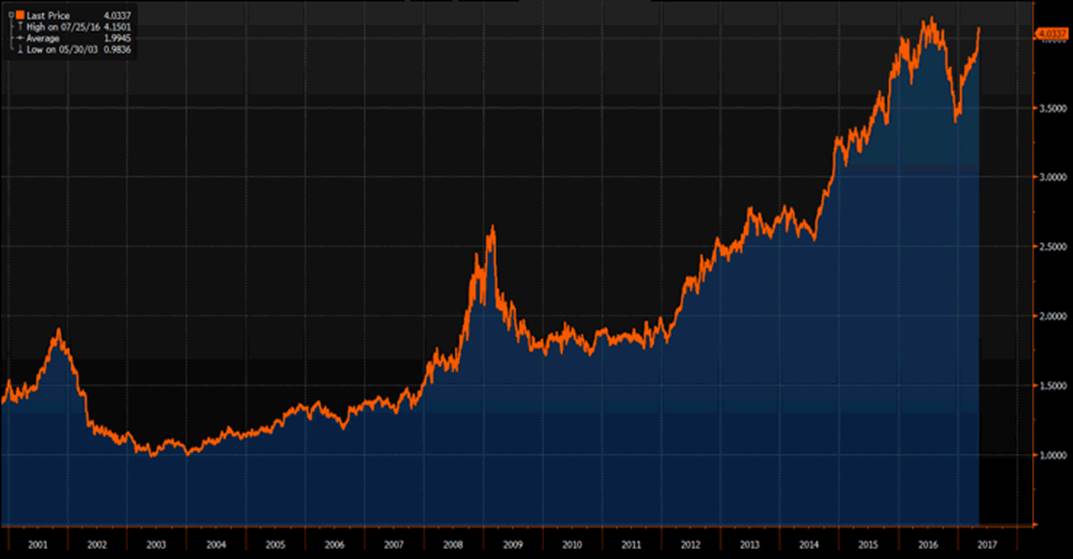
The sector that has worked well in 2017 has been healthcare, although some heat is coming out of the sector for now and investors are rotating some exposure into other sectors. The healthcare space is still outperforming the next best sector (utilities) by some 4.6 percentage points (with a ytd gain of 19.1%) and if we have look at the ratio of the ASX healthcare/ASX 200 at 4.0337 it is not far from breaking the July 2016 and all-time highs (see chart below). This remains the momentum trade and one can almost feel the investment community willing the sector down 2-3% more to rotate funds back here.
In FX land, the focus turns from USD/CAD to AUD/USD, given we get new vehicle sales and hear the Reserve Banks minutes at 11:30 aest. This comes ahead of Westpac consumer confidence, Q1 wage data and then Thursday’s jobs report. If the RBA’s key focus is housing, wages and jobs then in the next few days we have two of the three key pieces of the puzzle and we go into the release with the swaps market pricing three basis points of tightening over the coming 12 months, which seems fair, although the case for cuts outweighs that of hiking. AUD/USD goes into this week’s data with traders till happy to sell into rallies, which is what materialised overnight with a flood of offers into $0.7450.

