The Federal Reserve (Fed) seemingly used last week to outright communicate to markets that they intend to hike in the March meeting and we even saw a couple of unscheduled discussions from Fed members. When we see two governors (Brainard and Powell) and importantly three ‘core’ members of the Fed – Yellen, Fischer and Dudley, all say March is a serious consideration then we have to feel it is almost a given they hike.
The fact Vice Chair Fischer even went as far (on Friday) as saying ”if there has been a conscious effort” by other Fed members to communicate a hike then “I’m about to join it” really tells us all we need to know. Market pricing around the March meeting is rich though and is almost fully priced that they hike, and subsequently despite comments on Friday from Fischer and Yellen all but confirming a move in rates traders took profits on USD longs on Friday, with the USD index falling 0.7%, although still etched out a gain on the week of 0.5%.
The US fixed market has really where all the action has been and while we saw modest buying on Friday in the key five to seven-year part of the treasury curve, on the week we saw a fairly explosive move higher in yields as traders reacted to all the Fed rhetoric. The five-year US treasury yield pushed up a sizeable 20 basis points on the week and subsequently, it’s no surprise to see US real estate stocks and gold under pressure. Gold especially looks interesting, with price having broken the December uptrend.
All eyes fall on US payrolls on Friday, with expectations pushed up a touch throughout last week, with economists now expecting 190,000 jobs to be created in February, with the unemployment rate at 4.7% and hourly wage growth of 2.8%. I am not so sure this data point really moves the dial too much unless of course the actual print deviates wildly from consensus and the big driver of the USD, bonds and many higher yielding equities is really about how aggressive the Fed tighten going forward. So as a guide we can look at the interest rate markets and see 2.5 hikes priced in for 2017 (including a March hike), 4.5 hikes through to 2018 and a total of six through to 2019. Six hikes over the longer-term is still fairly pessimistic when we think the Fed have nine pencilled into their forecasts.
While potential Fed tightening dominates the conversation, the weekend news has largely centred on Trump (shock) and China’s National People’s Congress (NPC) and specifically Premier Li Keqiang’s modest alterations in economic projections in the government work report. It won’t surprise too many that we have seen the GDP target now set at ‘around 6.5%’, and the fact this should be supported by an unchanged fiscal deficit of 3% and comments that the government ‘aim to do better in practise’ suggests that growth will unlikely fall far from 6.5% and the consensus forecast (from economists) of 2017 ‘real’ GDP of 6.5% looks fair. Setting an M2 money supply target of 12% will also support.
AUD/USD traded in a range of $0.7543 to $0.7598 on Friday and has opened in early trade unchanged and looks largely unfazed by Li Keqiang’s announcements. Bulk commodity futures are modestly supportive of the ‘Aussie’, with iron ore, steel and coking coal futures gaining 1.8%, 1.5% and 1.9% respectively on Friday.
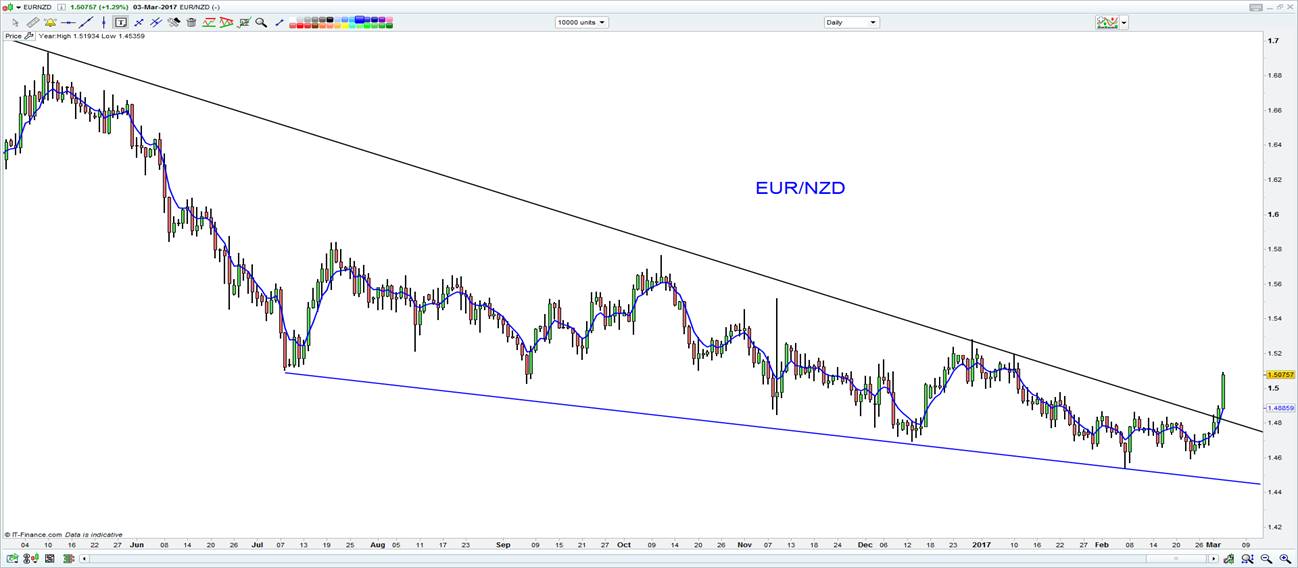
We have also seen a barrage of headlines around the French elections and a defiant Francois Fillon, who despite all the speculation is hell bent on running for the presidency in April/May. Keep an eye on the EUR, specifically against the antipodeans as EUR/NZD has broken above the longer-term downtrend and looks destined for higher levels. I suggested EUR/AUD longs on Friday and this idea has started on a solid footing.

So the wash-up is we should see Asian equities open on a slightly firmer footing, with BHP’s ADR up 1.4%. Oil prices have stabilised and had a reasonable session on Friday, with US crude closing up 1.4% on the back of concerns about near-term production issues in Libya. The US rig count (oil and gas) increased a further two rigs, taking the total to 756 and the highest since late 2015, but this shouldn’t impact the open of the crude futures market too greatly. We may see better buying in names like STO, who had a tough year so far.
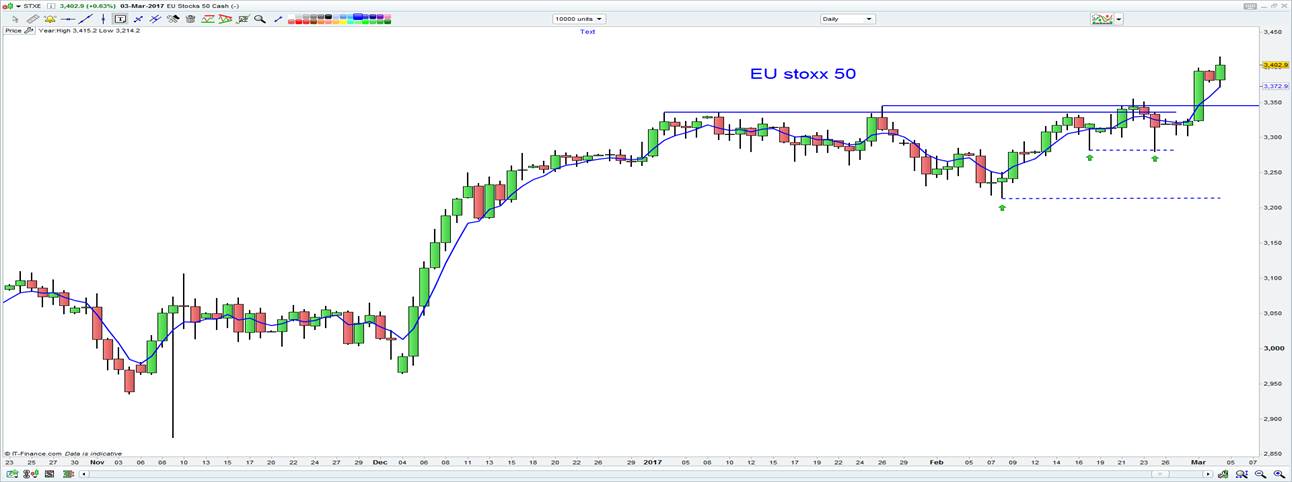
Overall, the ASX 200 is hanging in there and if looking at global indices the EU Stoxx 50 looks far more bullish on the daily charts and remains my pick to express an upbeat view. Ideally, we really need to see the SPI futures smash through 5790 (the 2017 double top) to get me excited about the ASX 200 cash breaking through 5833 and new highs in this period of consolidation. It’s hard to really be bearish though until 5600 is taken out, where we saw the buyers support prices a number of times through January and February.
So, just looking at the ASX 200 the clear playbook is defined by the levels of 5833 to 5600 and happy to use this as a guide on the directional bias.

