It will be an interesting trading week for all parts of the globe, but especially here in Australia, where we await a central bank who can aggregate all the madness occurring in the world and equate that to how it affects their policy settings. That will mean the massive boost from the RBA’s commodity index and record monthly trade surplus, offset by a trade-weighted AUD, which now sits at 66.4 and the highest levels since May 2015. RBA governor Dr Philip Lowe speaks on Thursday at 20:00 AEDT and then we get the Statement on Monetary Policy on Friday.
If the Reserve Bank want to tell us they are changing their tune around its seemingly current primary focus of financial stability then this week it should be. They won’t though, as the world’s economic data points are improving (although don’t look at the Baltic Dry index), corporate profitability is on the up and commodities have been strong. Like many, they may take the view that inflation has probably troughed in Australia and one can look at the swaps market and see a mere four basis points of tightening priced into the forward curve.
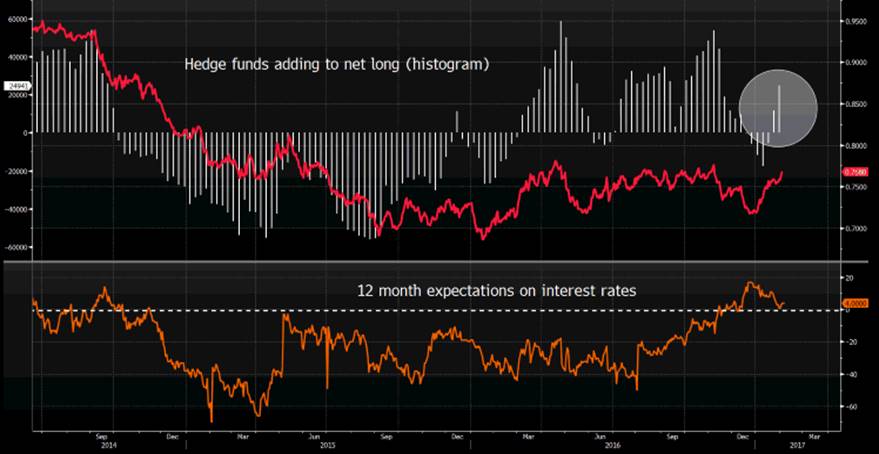
The subject of AUD strength continues to come up in conversation and this is not just a function of rampant commodity price gains. It is also a function of very low implied volatility (vol) in all markets and traders simply looking at getting paid to be in a position, which of course means buying into carry trades. We can see confirmation of this with hedge funds (or speculative funds) increasing their AUD net long position by 114% to 24,941 contracts last week (see right hand Bloomberg chart).
So, for the AUD to really head lower we are going to need to see a combination of lower commodity prices and a ramp-up in market volatility (to cause an unwind of the carry trade). With this in mind, watch the likes of iron ore, steel and coking coal futures (on the Dalian exchange) this week.
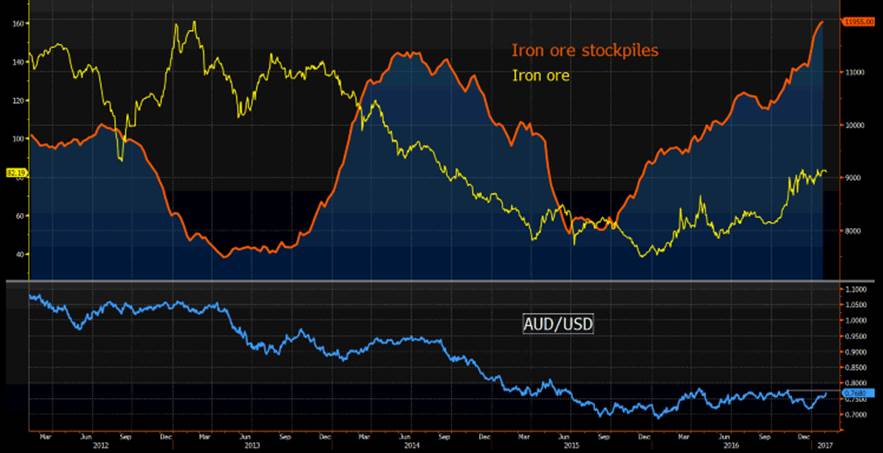
The combination of such extreme levels of port inventories (iron ore inventories at Chinese ports sits at a 10-year high – see chart below), amid a falling pace of fixed asset investment growth in State-Owned Enterprises (SOE) suggests prices may roll over and head lower now Lunar New Year is behind us. One to watch for those holding mining stocks too.


This is especially poignant as bulk commodity futures fell on the Friday night session, with iron ore -2.9%, steel -2.7% and coking coal -0.8%. Copper also lost 2.8%, with traders focusing on the PBoC tightening monetary policy on Friday, by increasing short-term interest rates on a number of money market functions and raising the cost to borrow from the central bank. I suspect we may see China’s short-term money market rates really being a leading indicator this week, so commodity traders will be watching 7-day repo’s and alike for signs of liquidity in China’s markets.
It should be a good day today for those holding Aussie banks though and if we marry the view that BHP’s ADR is down 2.2% and yet the SPI futures closed up 24 points (our call for the ASX 200 is 5650), it suggests the banks and especially Macquarie should do rather nicely on open. US banks flew on Friday as Mr Trump said he was going to have a good old look at Dodd-Frank and the idea of lower regulation in the banking sector.
Many will not agree with Trump’s humanitarian views, but you have to give him his dues that he is putting his promises into action with purpose. The S&P 500 financial sector rallied 2%, putting in seven of the S&P 500’s 16 points and probably would have had been up even more if the non-farm payrolls had detailed stronger wage data, with December average hourly earnings gaining 2.5% (the market was expecting 2.7%).
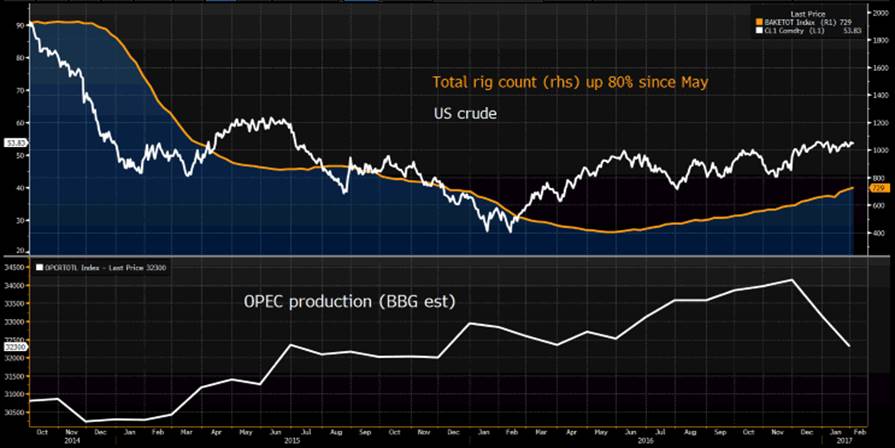
Energy did well in the US on Friday, with US crude oil pushing up modestly (+0.5%) to close at $53.83. If we look at US crude, it seems that price just looks so comfortable at current levels. That completely marries with the view that OPEC (and some non-OPEC) nations are adhering to agreed cuts (shock), while we saw another response from the shale gas producers, who brought a further 17 rigs online last week, taking the total now to 729 (see Bloomberg chart below). This total has increased 80% since May 2016 and a clear offsetting factor to the OPEC cuts.

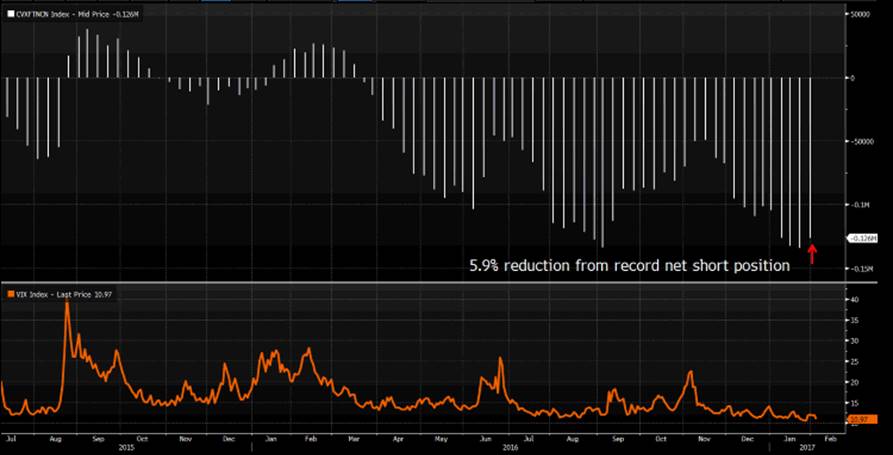
So we see a good open today in Asia, driven by financials, but one area worth keeping an eye on this week is implied volatility measures, such as the ‘VIX’. We have seen some reduction from the record level of net shorts on VIX futures last week, but at 10.97% the VIX has had two consecutive weekly closes below 11%. To put this in perspective, the last time this occurred was in January 2007!
Trump could do anything and we expect him to do so, with some focus this week on his meeting (Saturday) with Japanese PM Shinzo Abe. It also seems that the focus on the April/May French elections is ramping up, with Marine Le Pen rolling out her presidential campaign on Saturday. The French elections are clearly a major event risk for markets, although favourite Emmanuel Macron is looking good in a potential face-off versus Le Pen on 7 May.
(Last week we saw a 5.9% reduction in VIX futures shorts, off record levels)

