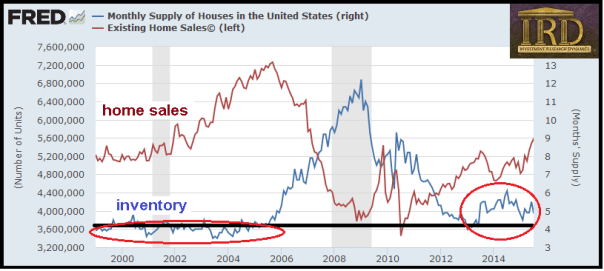
As with all other highly manipulated data, the financial media has a blind bias toward the “bullish” story attached to the housing market. Understandable, as the National Association of Realtors spends more on special interest interest lobbying in Congress than any other financial sector lobby interest, including Wall Street banks.
New home sales were down last month, according to the Census Bureau, 11.3% and missed Wall Street’s soothsayer estimates by a rural mile. Strange, that report, given that new home-builder sentiment is bubbling along a record highs. Existing home sales were down 2.3%. You’ll note that the numbers reported by the Census Bureau and NAR are “SAAR” – seasonally adjusted annualized rates. There is considerable room for data manipulation and regression model bias when a monthly data sample is “seasonally adjusted/manipulated” and then annualized. You’ll also note that mortgage rates have dropped considerably from their December highs and May is one of the seasonally strongest months for home sales.
It’s becoming pretty clear to me that the housing market’s “Roman candle” has lost its upward thrust and is poised to fall back to earth. I believe it could happen shockingly fast. Fannie Mae released its home purchase sentiment index, which FNM says is the most detailed of its kind.
The report contained some “eyebrow-raising” results. The percentage of Americans who say it’s a good time buy a home net of those who say it’s a bad time to buy a home fell 8 percent to 27% – a record low for this survey. At the same time the percentage of those who say its a good time sell net of those who say its a bad to sell rose to 32% – also a new survey high. In other words, homeowners on average are better sellers than buyers of homes relative to anytime since Fannie Mae has been compiling these statistics (June 2010).
Currently the prevailing propaganda promoted by the National Association of Realtors’ chief “economist” is that home sales are sagging because of “low inventory.” He’s been all over this fairytale like a dog in heat. The problem for him is that the narrative does not fit the actual data – data compiled by the National Association of Realtors – thereby rendering it “fake news:”

The graph above shows home inventory plotted against existing home sales from 1999 to 2015 (note: when I tried to update the graph to include current data, I discovered that the Fed had removed all existing home sales data prior to 2013). As you can see, up until Larry Yun decided to make stuff up about the factors which drive home sales, there is an inverse correlation between inventory and the level of home sales (i.e. low inventory = rising sales and vice versa). I’m not making this up, it’s displayed right there in the data that used to be accessible at the St Louis Fed website.
Furthermore, if you “follow the money” in terms of new homebuilder new housing starts, you’ll discover that housing starts have dropped three months in a row. The last time this occurred was in June 2008. IF low inventory is the cause of sagging home sales – as Larry Yun would like you to believe – then how come new homebuilders are starting less homes? If there’s a true shortage of homes, homebuilders should be starting as many new units as they can as rapidly as possible.
Although the Dow Jones Home Construction Index is near a 52-week high – it’s still 40% below it’s all-time high hit in 2005. Undoubtedly it’s being dragged reluctantly higher by the S&P 500, Dow, NASDAQ and Tesla (NASDAQ:TSLA).
Despite this, I presented a homebuilder short idea to subscribers of the Short Seller’s Journal that is down 13.6% since I presented it May 19th.It’s been down as much as 24.2% in that time period. It is headed to $7 or lower, likely before Christmas. I also presented another not well followed idea that could easily get cut in half by the end of the year.
