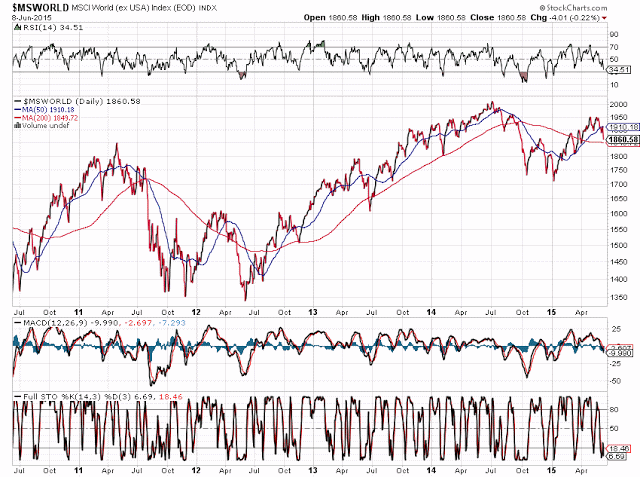
Further to this post, the fireworks have begun...see the updated Daily chart below of the World Market Index, as of yesterday's close.
1900 was major support, which has been broken...watch for a potential drop to 1600 or lower, as mentioned in my UPDATE of May 22nd (noted in my original post of early March).
However, watch out for a possible bear trap...anywhere between 1850 and 1875. The RSI should stay below the 50 level to confirm that bears are in control.

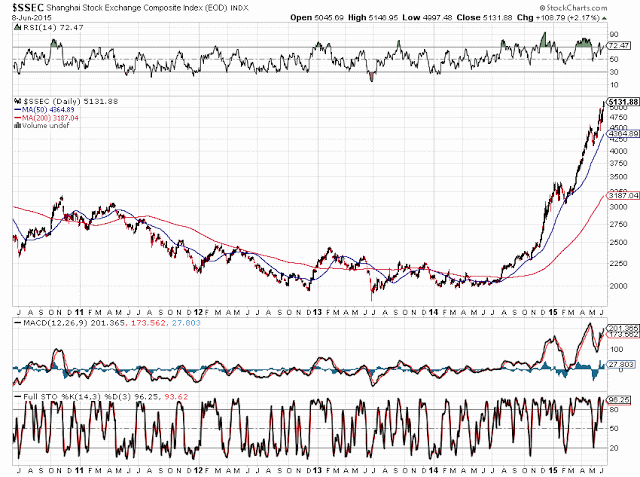
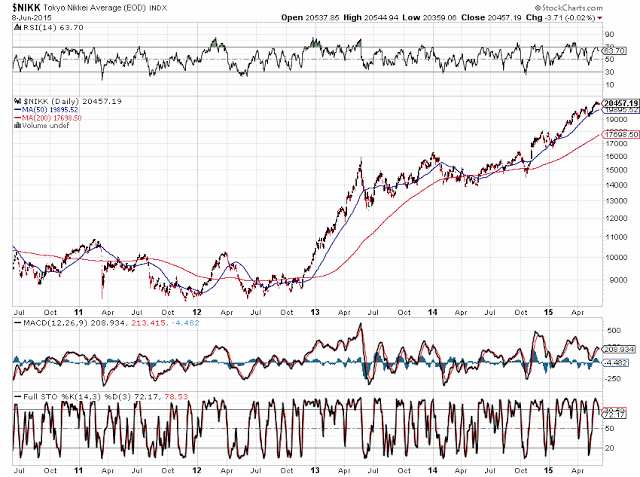
I will say that it is interesting that this index has fallen, in spite of the dizzying heights reached by China's Shanghai Index and Japan's Nikkei Index...note the negative-diverging indicators on the following 2 Daily charts. If we see blow-off tops occur in these, we just may, in fact, see the World Market Index drop to 1600...rather quickly.


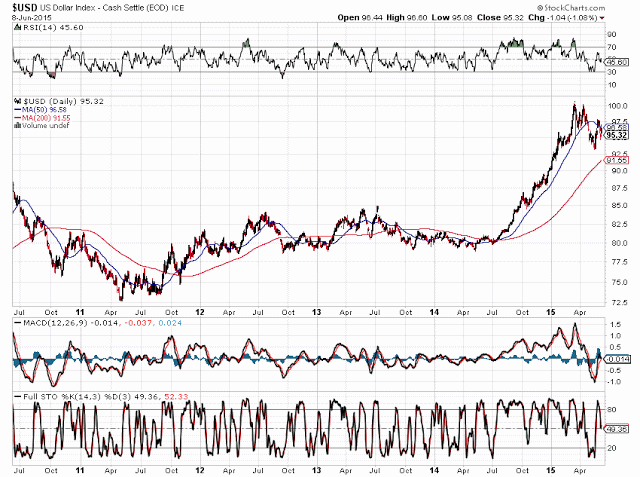
We may see an early indication of such bearish action play out in the currency markets...the U.S.dollar is sitting just above major support at 95.00, as shown on the last Daily chart. Watch for the RSI to move back above the 50 level as an indication that bulls are back in this trade.

