I first wrote about the World Market Index back in March…you’ll see subsequent updates there, as well.
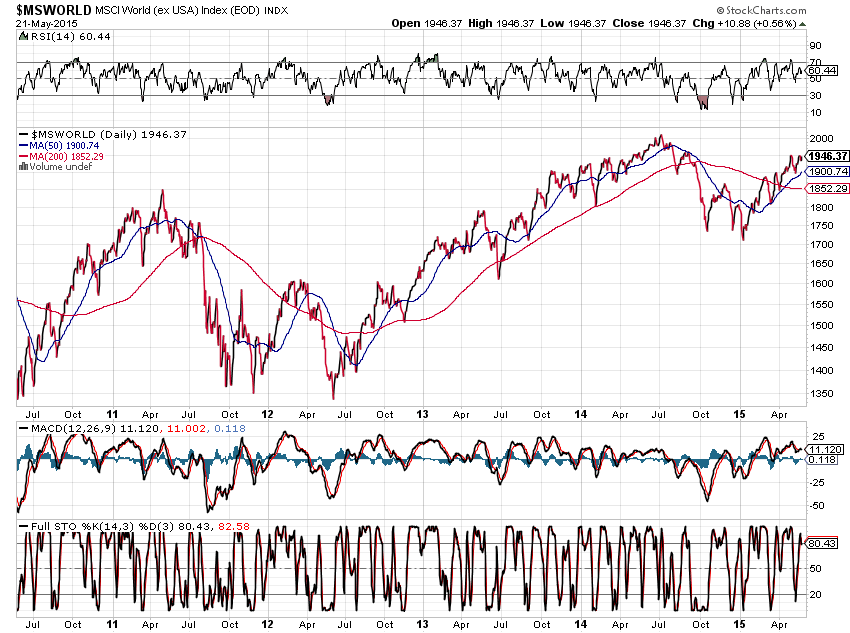
The following updated chart, as of Thursday’s close, shows that price has broken above the 1900 major resistance level, retested it and bounced, after a bullish moving average Golden Cross formed in mid-April.
With all three technical indicators declining in value since the swing high of 1949.91 set on April 27, we’ll need to see price break and hold above that major resistance level, with confirmation of higher highs on the RSI, MACD and Stochastics indicators. Otherwise, we could see a major reversal at what could be considered a right shoulder of a bearish Head and Shoulders formation (with a downward-sloping neckline), that could send world markets tumbling considerably to around the 1600 level, or lower.

