Market Review and Update
Over the last several weeks, we have been discussing the potential for a correction of the S&P 500 simply due to divergences in the technical indicators which suggested near-term market risk outweighed the reward. As is generally the case, bonds have been warning that the bullish bias of equity investors was likely misplaced. I have updated last week’s chart for reference.
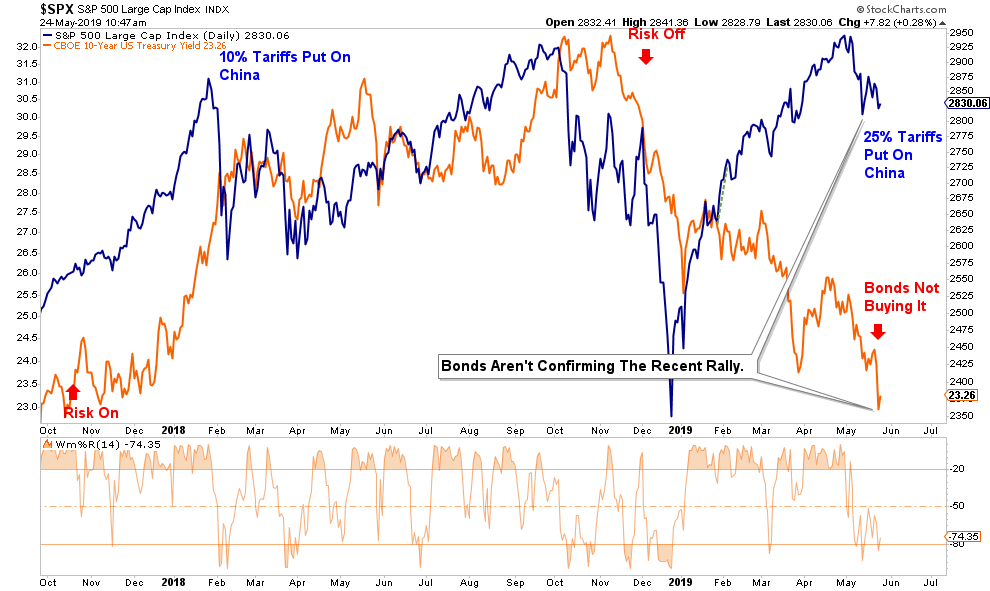
The increase in risks has had us rotating exposure in our portfolios to a more defensive tilt. We previously trimmed back our overweight exposure to Technology, then, two weeks ago, we noted we further tweaked client portfolios by reducing exposure to “trade sensitive” areas by selling half of our holdings in Industrials, (Materials, and Discretionary areas.
Last week, we continued to process of the defensive rotation, reducing risk, and rebalancing allocations.
“As noted in our newsletter over the last couple of weeks, we are seeing the early signs of a defensive rotation in equities due to the resurgence of the trade war. Therefore, we are moving our allocations accordingly to participate with the rotation.
We are adding to our real estate exposure, which is interest rate sensitive, and we are overweighting our defensive holdings in utilities and NYSE:staples.
After recently lengthening duration in our bond portfolios, we will look for a short-term reversal in rates, which will coincide with a counter-trend market bounce, to add further to our position in IEF.“
Importantly, we still maintain a long-bias towards equity risk, but that exposure is hedged with cash and bonds which remain at elevated levels.
Looking Forward
Currently, on a very short-term basis, the markets have worked off some of the overbought condition from last month and, importantly, has held support at the October-November 2018 highs. There is additional support at the 200-dma just below current support at 2775. These are key support levels for the S&P 500 as we head into the summer months and, if the bulls are going to maintain their stance, must hold.
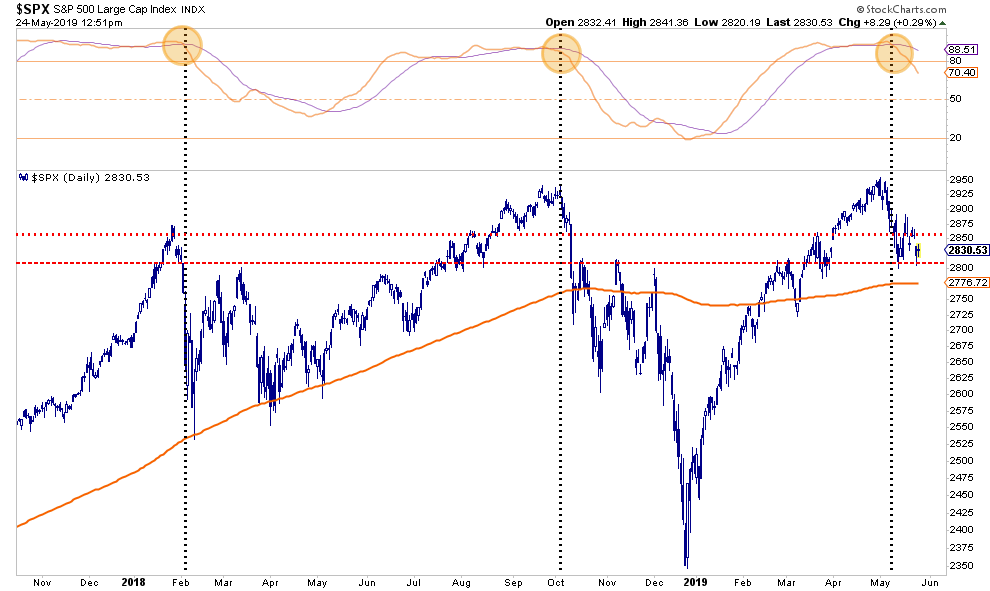
The reason we maintain a more defensive posture is the triggering of the intermediate-term “sell signal” (yellow highlights above) suggest that prices will remain under pressure for a while longer. (Hence the rotation to defensive positioning.)
Let me reiterate four very crucial points the markets have NOT factored in just yet:
- There will be NO TRADE DEAL any time soon. (China is buckling down for a long fight.)
- Earnings estimates are still far too high going into the end of 2019 and 2020.
- The economy will weaken further as the latest rounds of tariffs, which take effect June 1st, begin to impact the economy headed into the last half of 2019.
- The Fed is unlikely to lower rates, or increase their balance sheet, prior to a recessionary start or a substantially deep correction in the market. (i.e. more than 20% from current levels)
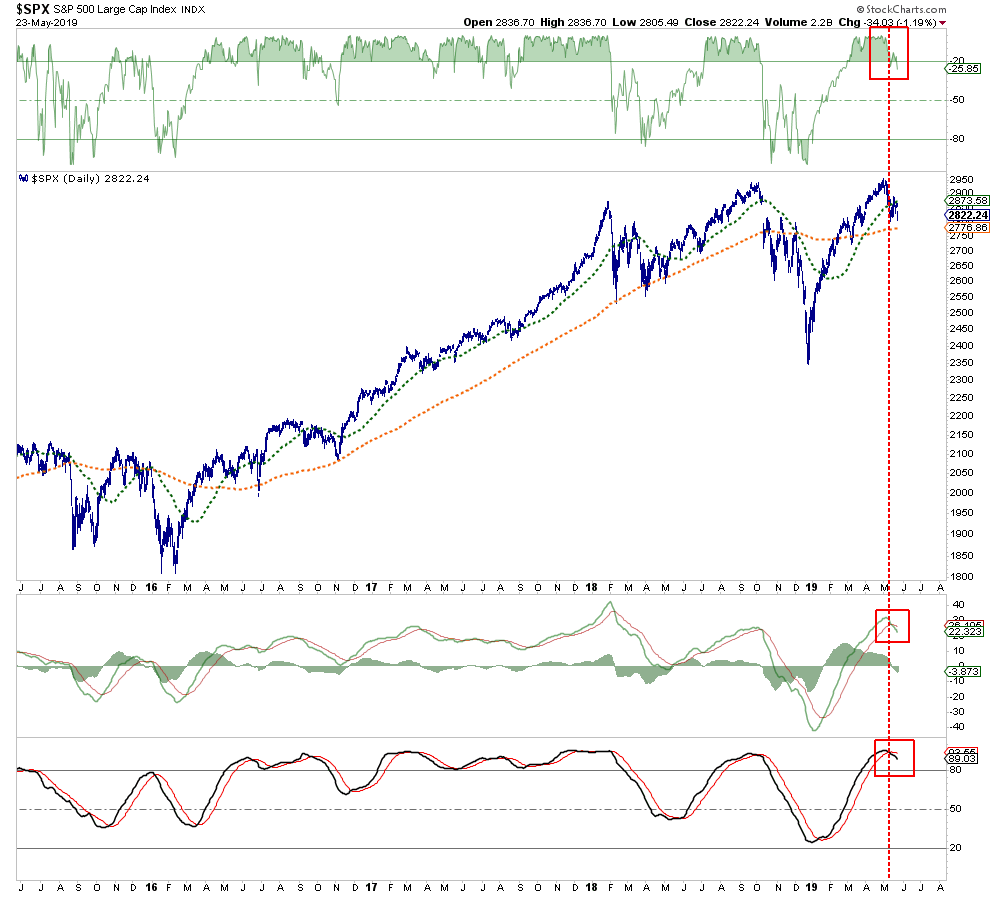
For now, as stated, the market is working a corrective process which is likely not complete as of yet. As we head into the summer months, it is likely the markets will experience a retracement of the rally during the first quarter of this year. As shown in a chart we use for position management (sizing, profit taking, sells) the market has just issued a signal suggesting risk reduction is prudent. (This doesn’t mean sell everything and go to cash.)
Just one other thing, I don’t like market comparisons because no two market cycles are alike. However, price patterns are important because they represent the “psychology of the herd.” The chart below shows the market in the months leading up to the Dot.com crash, the Financial Crisis, and where we are currently.
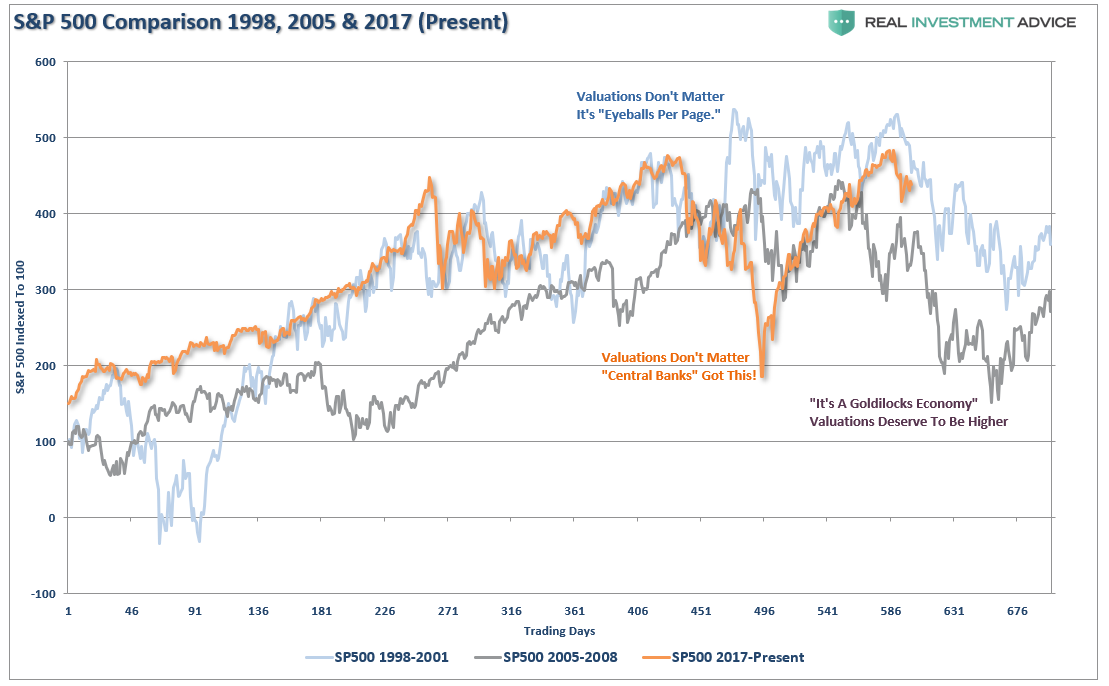
Again, no two market cycles are the same. The drivers which facilitate the bull run, and the catalyst which ends it, are ALWAYS different.
It is just investor behavior which is always the same.
The Bulls Continue To Bet On The Fed
Last week, we noted that the earnings growth story is going to become increasingly difficult to ignore.
“This is particularly the case given that just this past week economic data continues to show weakness. As shown in the following chart, global economic trade has collapsed to levels not seen since prior to the financial crisis.”
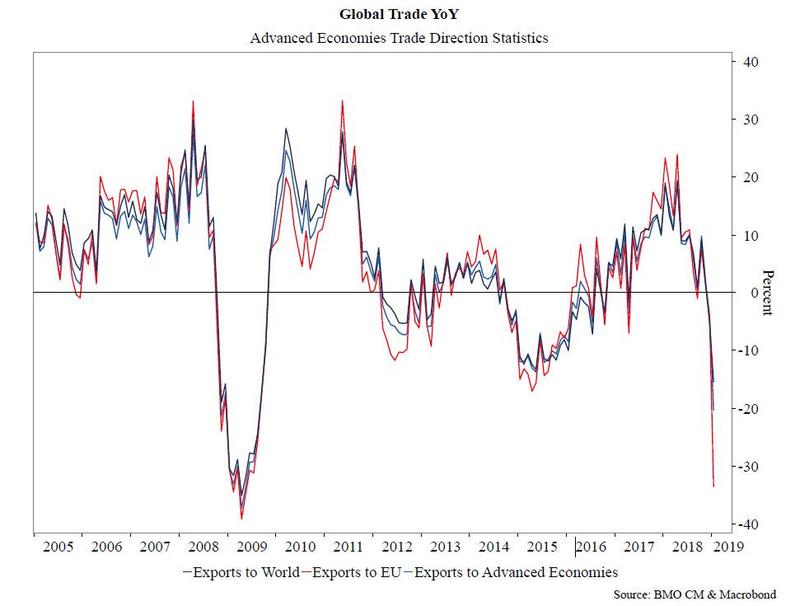
Of course, since almost 50% of corporate revenue and profits are generated from international activity, it is not surprising to see a problem emerging. But importantly, watch what is happening domestically as well.
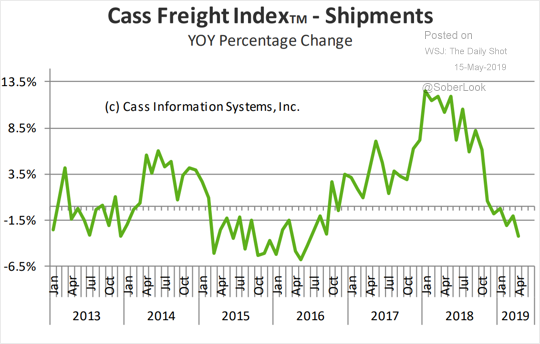
These are early signs of economic weakness.
“But Lance, employment is still very strong. So what gives?”
The employment number from the BLS is adjusted, tweaked, and mathematically abused. As an indicator, it is one of the worst to watch and is subject to very large negative revisions in the future. Most importantly, the labor market is the LAST thing to turn in a cycle as employees are slow to hire and slow to fire. For a better understanding of employment look at the household survey. It is showing signs of weakening employment which supports why companies are now laying off workers.
(Also, notice the rate of change in employment has, not surprisingly, run at roughly the rate of actual economic growth. Given that first quarter GDP was 1.8%, when adjusted for inventories and imports, it aligned with the 1.66% rate in employment. Employment is driven by actual economic strength.)
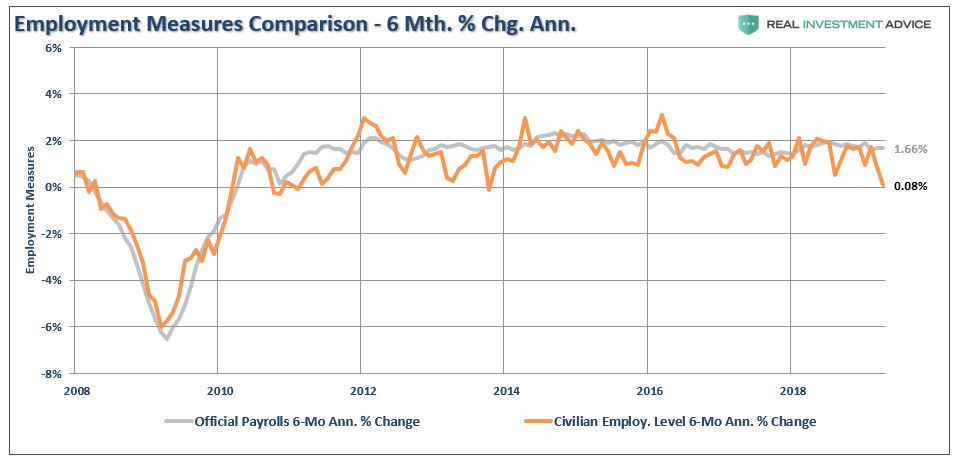
Importantly, the first time the household survey was sitting at 0% rate of change was right after QE1 ended, the economy started sliding and Ben Bernanke launched QE2. The second time was during the 2012 manufacturing recession. As the economy was sliding, Ben Bernanke launched QE3 which pulled forward consumption was again. In both previous cases, however, Fed funds were near zero, the Fed’s balance sheet was growing, and recession risks were essentially nil.
Today, recession risks are the highest seen since 2007.
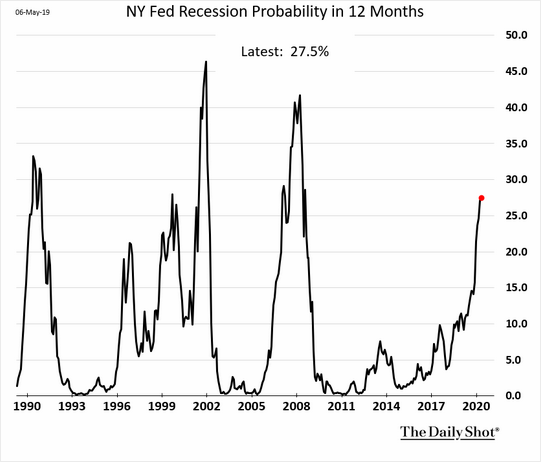
(Important Note: The graph above is based on lagging economic indicators which are subject to huge negative revisions in the future. Therefore, high current risk levels should not be readily dismissed as the recession will have started before the data is revised to reveal the actual start date.)
But more importantly, the Fed is no longer expanding their balance sheet and the Fed Funds rate is near 2.5%. Also, it isn’t just the Fed extracting liquidity, Central Banks globally are curtailing their “emergency measures.”
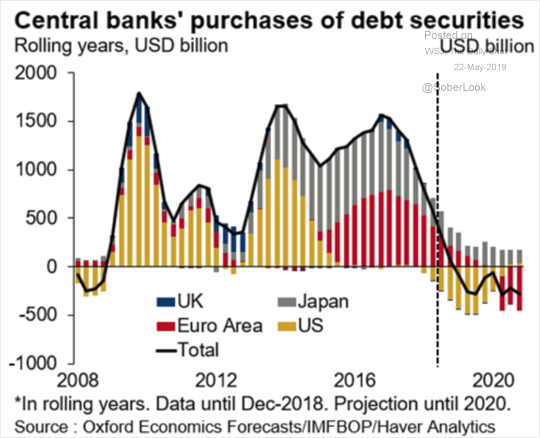
Still, the bulls continue to operate under the assumption the Federal Reserve has eliminated the business cycle.
“I don’t see a world in which we have any form of meaningful contraction nor any form of meaningful expansion. We have completely taken away the toolkit of how normal economies should work when we started with QE. I mean, the odds that there’s a recession anymore in any Western country of the world is almost next to impossible now, save a complete financial externality that we can’t forecast.” – Chamrath Palihapitiya on CNBC last week.
However, this is not likely the case as noted by Lakshman Achuthan of the Economic Cycle Research Institute (ECRI):
“A proposition has taken shape the Fed has eliminated business cycles through quantitative easing (QE) and unconventional monetary policy. As a result, we have credit cycles that can prolong economic expansion, in theory, forever.”
This all sounds so familiar.
“In the late 1990’s, during the longest expansion in U.S. history, the idea of the end of the business cycle went practically mainstream, being written up in the Wall Street Journal and Foreign Affairs. Between glottalization and the tech boom – which led to dramatic improvements in supply chain management, subduing inventory cycles – the argument went that we had arrived at the end of the business cycle.” – ECRI
Of course, just a couple of short years later the business cycle returned with a vengeance.
But, here are once again with the latest iteration of why “this time is different.” The current cycle, which certainly seems never ending, has been built upon on ultra-low interest rates and rising levels of debt. As we discussed last week, the Fed is now tacitly warning about the risks in corporate debt.
“Officials, for the second time in six months, cited potential risks tied to non-financial corporate borrowing, particularly leveraged loans—a $1.1 trillion market that the Fed said grew by 20% last year amid declining credit standards. They also flagged possible concerns in elevated asset prices and historically high debt owned by U.S. businesses.”
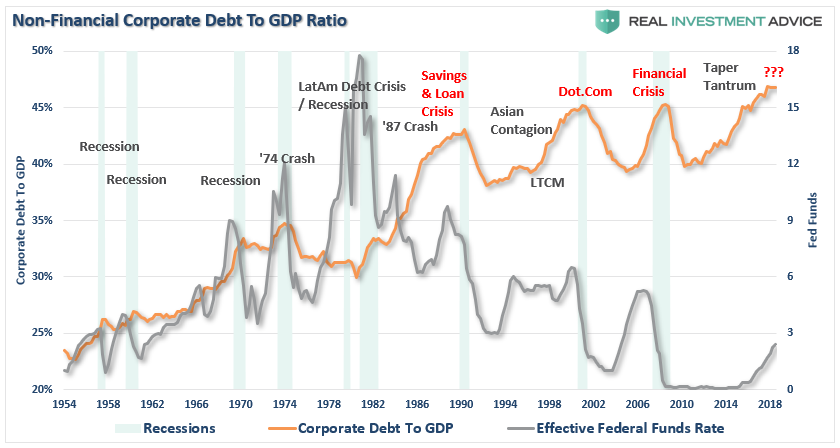
Notice that when the Fed starts hiking rates, historically, combined with corporate debt-to-GDP at peak levels, bad things have tended to occur…repeatedly. Furthermore, the amount of corporate debt is stacked up at the bottom end of the “investment grade” scale.
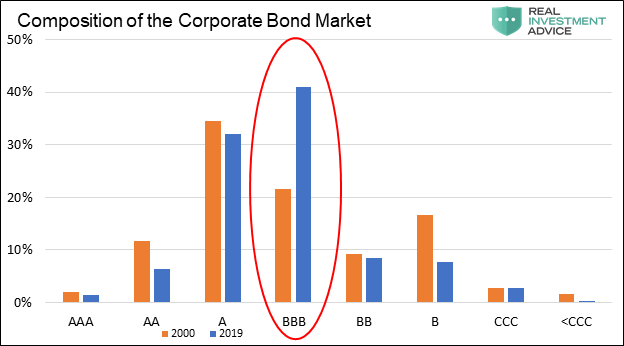
As Michael Lebowitz pointed out last week:
“Given that downgrades are a real and present danger and there is real potential for a massive imbalance between the number of buyers and sellers of junk debt, we need to consider how close we may be to such an event. To provide perspective, we present a graph courtesy of Jeff Gundlach of DoubleLine.”
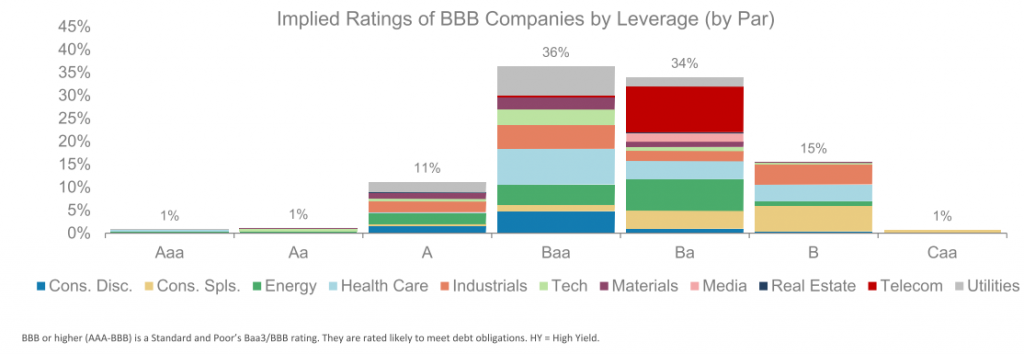
“If 50% of BBB-rated bonds were to get downgraded, it would entail a shift of $1.30 trillion bonds to junk status. To put that into perspective, the entire junk market today is less than $1.25 trillion, and the subprime mortgage market that caused so many problems in 2008 peaked at $1.30 trillion. Keep in mind, the subprime mortgage crisis and the ensuing financial crisis was sparked by investor concerns about defaults and resulting losses.”
Why worry? With just under 2/3rd of the BB (junk rated) bonds clustered in the top-15 industry groups what is the worst that could happen?
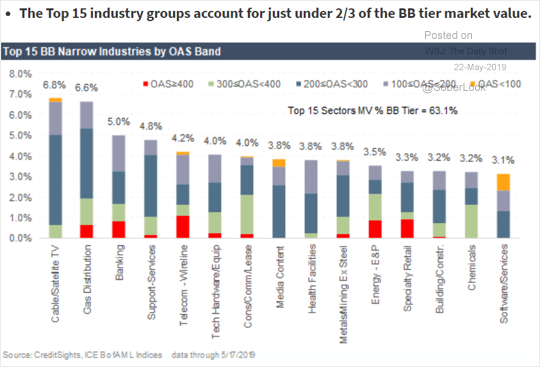
The problem comes if there is a recession. If that occurs, there will be a massive wave of downgrades of BBB to BB, or less, which means that major pension, institutional, and mutual fund managers will be forced to liquidate their bonds. Since such an event would most likely occur with the onset of a recession, the real risk comes when the junk bond market, which already has thin liquidity, simply becomes illiquid.
It won’t require much of an economic change to ignite the credit issue which currently exists. Once the liquidation process begins, liquidity for companies will quickly evaporate leading to forced bankruptcies. In turn, the stock market will decline as job losses mount and consumption falters.
This is more commonly known as a “recession.”
The “R” Word
Despite hopes to the contrary, the U.S., and the globe, will experience another recession. The only question is the timing.
As I quoted in much more detail in the newsletter a couple of weeks ago, Doug Kass laid out a decent list of the problems facing investors currently.
- Slowing Domestic Economic Growth
- Slowing Non-U.S. Economic Growth
- The Earnings Recession
- The Last Two Times the Fed Ended Its Rate Hike Cycle, a Recession and Bear Market Followed
- The Strengthening U.S. Dollar
- Message of the Bond Market
- Untenable Debt Levels
- Credit Is Already Weakening
- The Abundance of Uncertainties
- Political Uncertainties and Policy Concerns
- Valuation
- Positioning Is to the Bullish Extreme
- Rising Bullish Sentiment (and The Bull Market in Complacency)
- Non-Conformation of Transports
But herein lies the most important point about recessions, market reversions, and systemic problems.
What Chamrath Palihapitiya said above was both correct and naive.
He is naive to believe the Fed has “everything” under control and recessions are a relic of the past. Central Banks globally have engaged in a monetary experiment hereto never before seen in history. Therefore, the outcome of such an experiment is also indeterminable.
Secondly, when Central Banks launched their emergency measures, the global economies were emerging from a financial crisis not at the end of a decade long growth cycle. The efficacy of their programs going forward is highly questionable.
But what Chamrath does have right were his final words, even though he dismisses the probability of occurrence.
“…save a complete financial externality that we can’t forecast.”
Every financial crisis, market upheaval, major correction, recession, etc. all came from one thing – an exogenous event that was not forecast or expected.
This is why bear markets are always vicious, brutal, devastating, and fast. It is the exogenous event, usually credit related, which sucks the liquidity out of the market causing prices to plunge. As prices fall, investors begin to panic sell driving prices lower which forces more selling in the market until, ultimately, sellers are exhausted.
It is the same every time.
While investors insist the markets are currently NOT in a bubble, it would be wise to remember the same belief was held in 1999 and 2007. Throughout history, financial bubbles have only been recognized in hindsight when their existence becomes “apparently obvious” to everyone. Of course, by that point is was far too late to be of any use to investors who have already suffered a significant destruction of invested capital.
This time will not be different. Only the catalyst, magnitude, and duration will be.
Believing the “Fed has it all under control” has historically been a bad bet.
See you next week.
