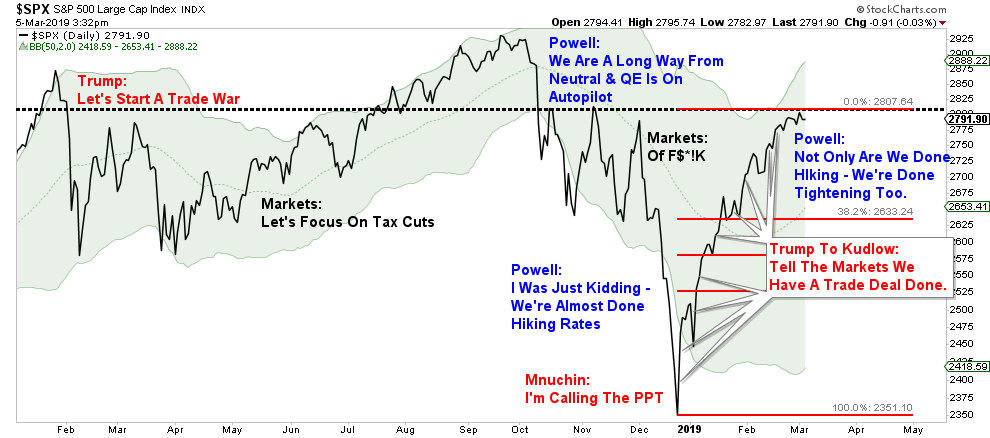
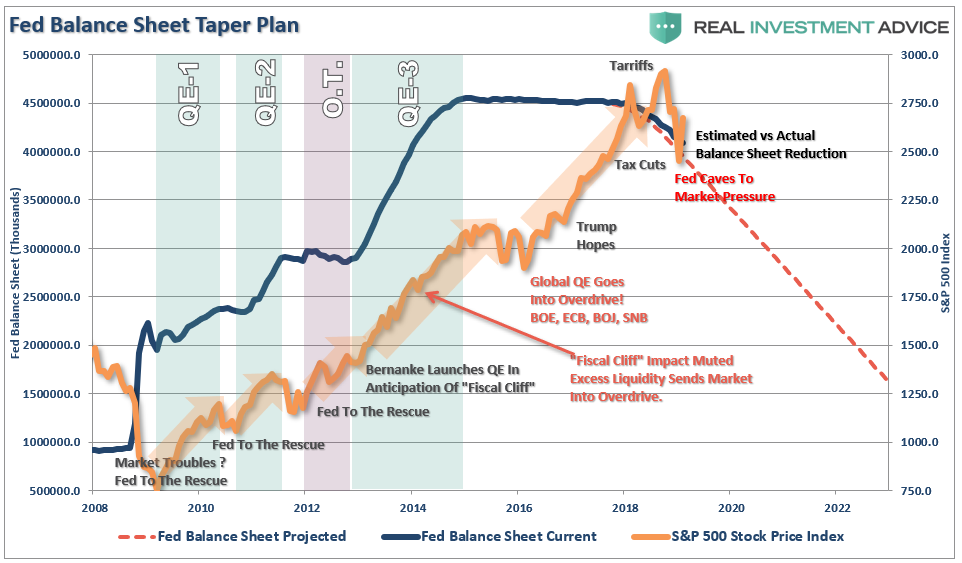
Since the beginning of the year, the market has rallied sharply. That rally has been fueled by commentary from both the Trump Administration and the Federal Reserve of the removal of obstacles which plagued stocks in 2018. The chart below is an abbreviated, and a bit sarcastic, version of events.
While the resolution of the trade war is certainly beneficial to the economy, as it removes an additional tax on consumers, the biggest support for the market has been the assumption the Fed will return to a much more accommodative stance.
- The Fed will be “patient” with future rate hikes, meaning they are now likely on hold as opposed to their forecasts which still call for two to three more rate hikes in 2019 and more in 2020.
- The pace of QT, or balance sheet reduction, will not be on “autopilot” but instead driven by the current economic situation and tone of the financial markets. It is expected the Fed will announce in March that QT will end and the balance sheet will stabilize at a much higher level.
- QE is a tool that WILL BE employed when rate reductions are not enough to stimulate growth and calm jittery financial markets.
In mid-2018, the Federal Reserve was adamant a strong economy, and rising inflationary pressures required tighter monetary conditions. At that time they were discussing additional rate hikes and a continued reduction of their $4 Trillion balance sheet.
All it took was a rough December, pressure from Wall Street’s member banks, and a disgruntled White House to completely flip their thinking.
The Fed isn’t alone.
China has launched its version of “Quantitative Easing” to help prop up its slowing economy.
Lastly, the ECB downgraded Eurozone growth, and there is a likelihood that not only will they not raise rates this year, they will also extend the TLTRO program which is the Targeted Longer-Term Refinancing Operations scheme which gives cheap loans to struggling Eurozone banks.
Think about this for a moment.
For a decade the global economy has been growing. Market participants are crowing about the massive surge in asset prices as clear evidence of the strength of the economy.
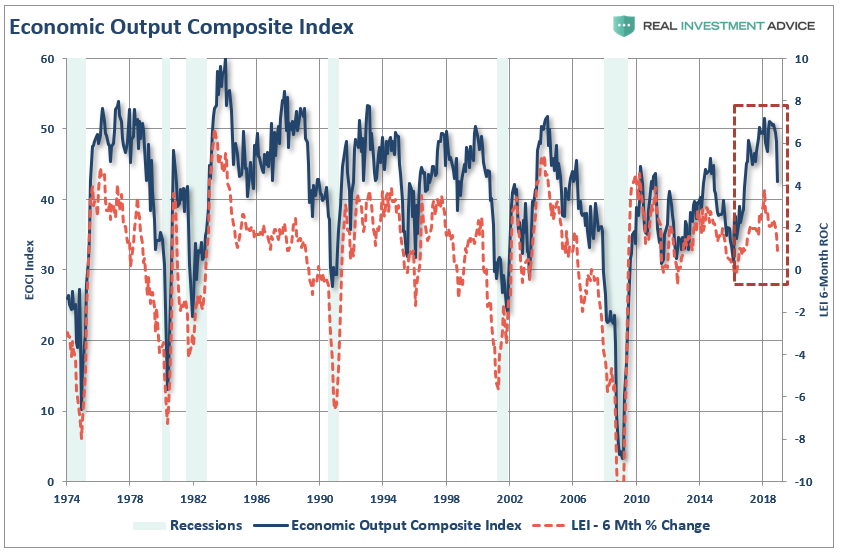
However, such hasn’t been the case. As I discussed previously for the Fed, China, and the ECB, are signaling their concerns about “economic reality,” which as the data through the end of December shows, the U.S. economy is beginning to slow.
“As shown, over the last six months, the decline in the LEI has been sharper than originally anticipated. Importantly, there is a strong historical correlation between the 6-month rate of change in the LEI and the EOCI index. As shown, the downturn in the LEI predicted the current economic weakness and suggests the data is likely to continue to weaken in the months ahead.”
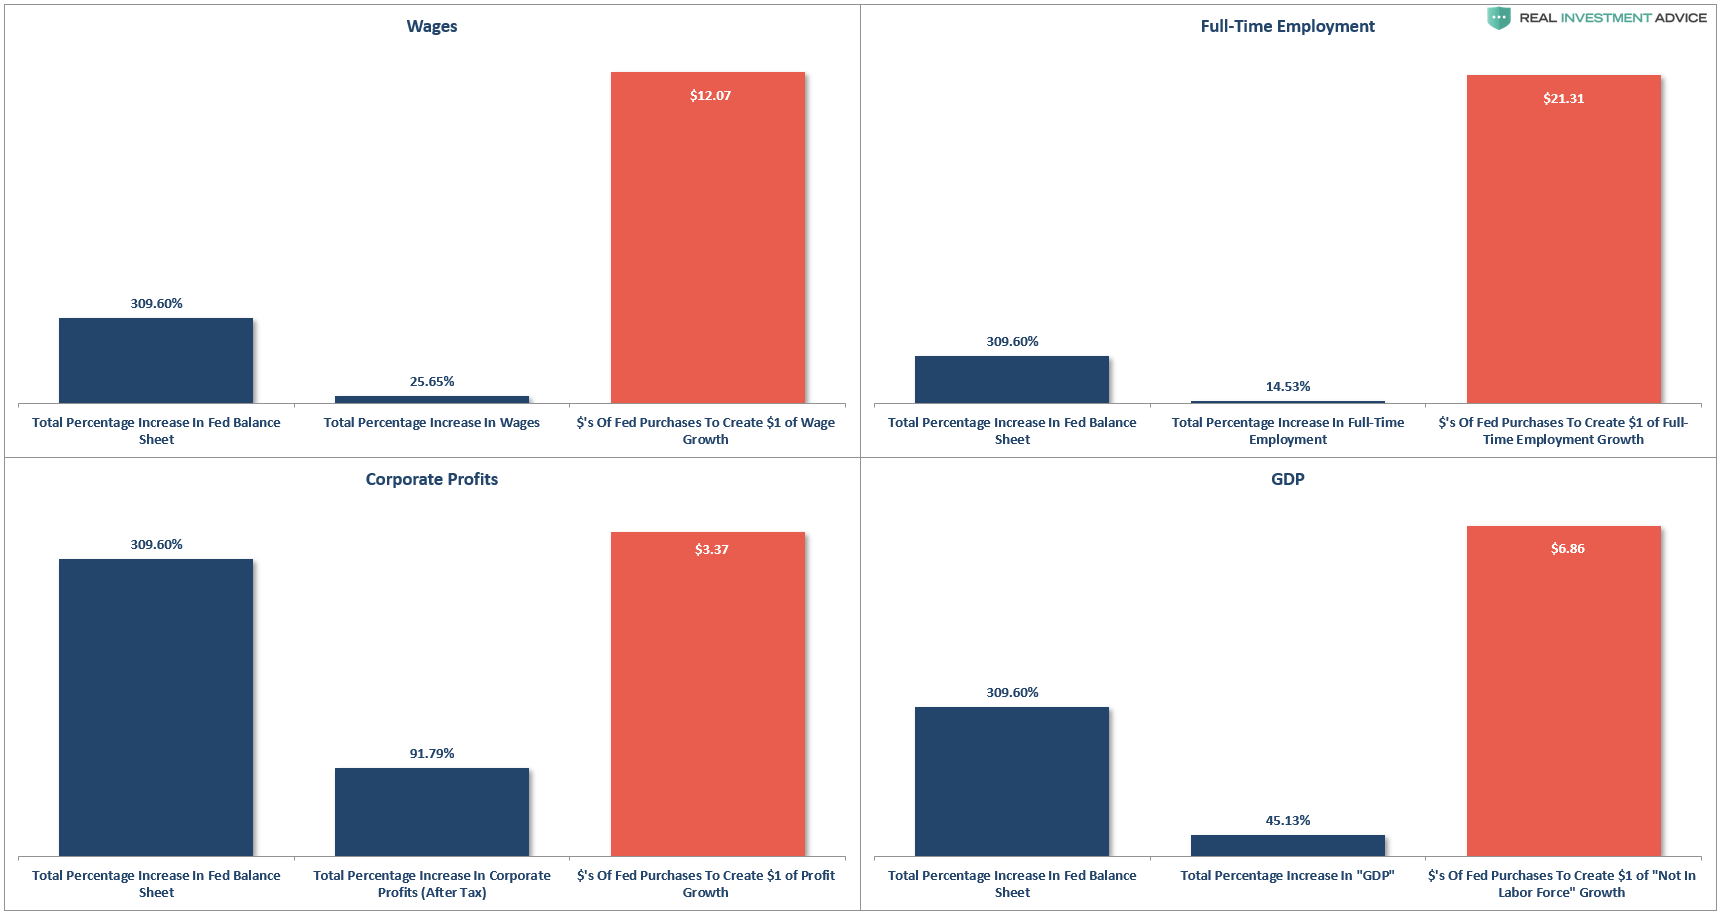
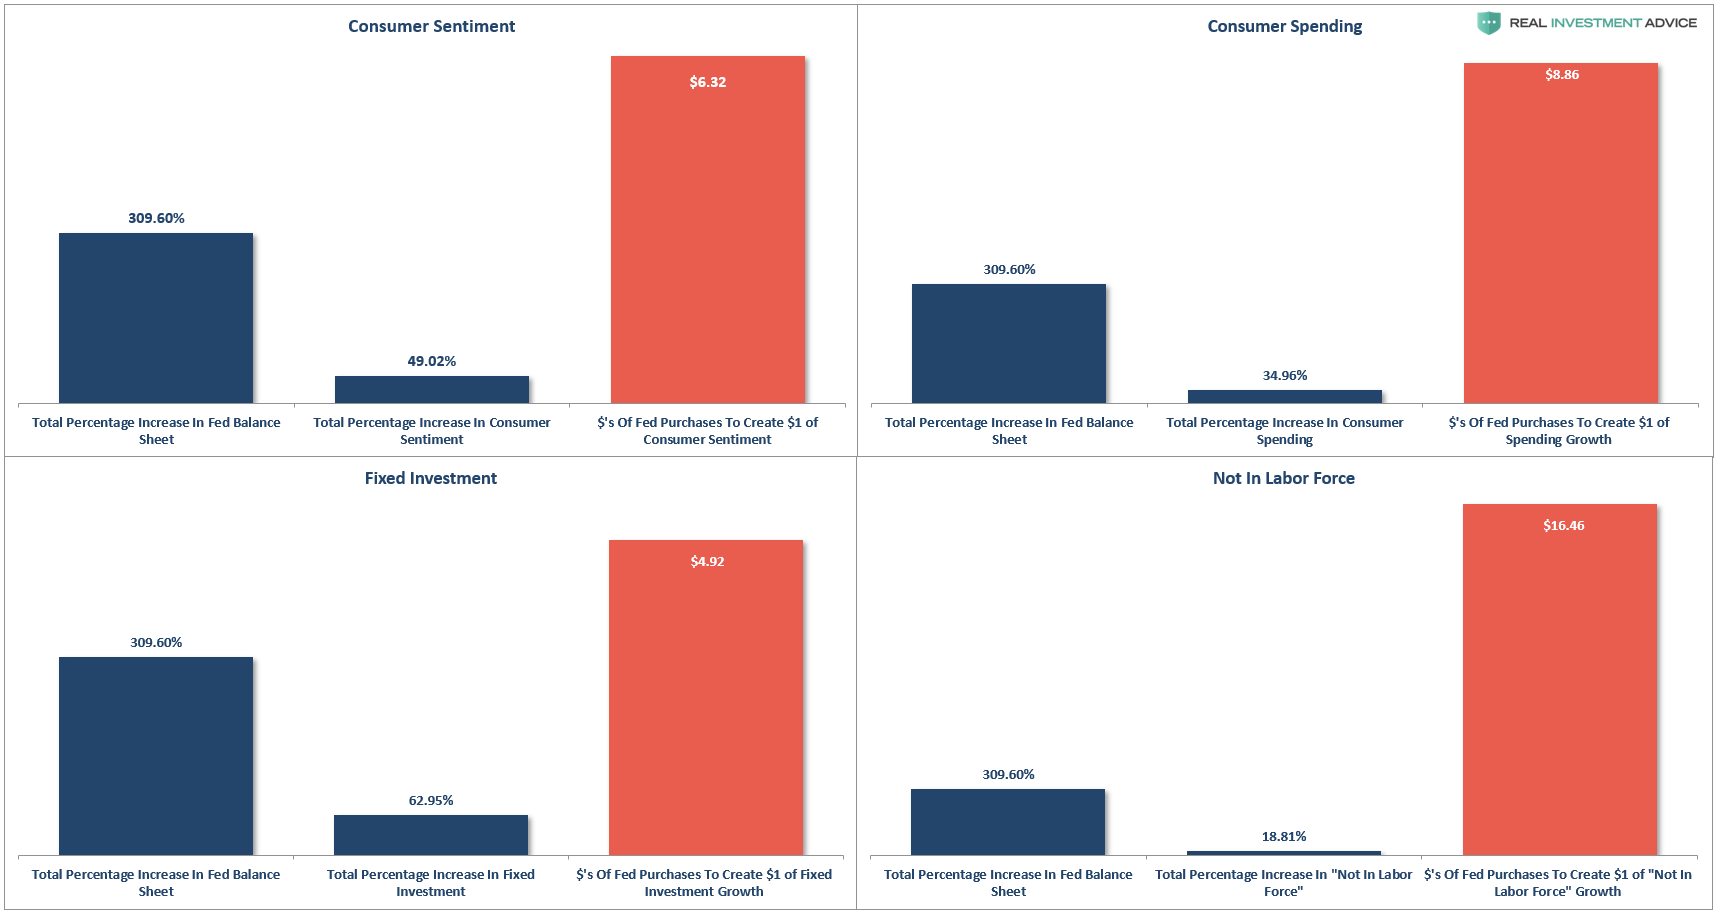
More importantly, monetary policy never really impacted the economy as prolifically as was anticipated following the financial crisis. The two 4-panel charts below show the percentage change in the Fed’s balance sheet from 2009-present (309%) versus the total percentage change in various economic components. I have also included the amount of stimulus required to create those changes.
First, it is interesting to note that despite headlines of strong employment growth, the percentage of people considered “Not In Labor Force or NILF” has grown more than full-time employment. Of course, and not surprisingly, the biggest beneficiary of monetary policy was…corporate profits.
Secondly, where monetary policy did work was lifting asset prices as shown in the chart and table below.
The table above shows that QE1 came immediately following the financial crisis and had an effective ratio of about 1.6:1. In other words, it took a 1.6% increase in the balance sheet to create a 1% advance in the S&P 500. However, once market participants figured out the transmission system, QE2 and QE3 had an almost perfect 1:1 ratio of effectiveness. The ECB’s QE program, which was implemented in 2015 to support concerns of an unruly “Brexit,” had an effective ratio of 1.5:1.
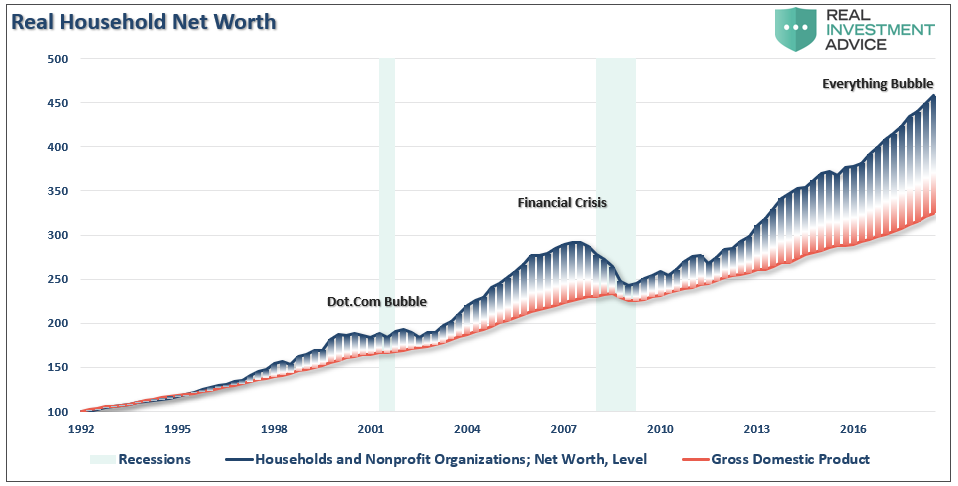
Clearly, QE worked well in lifting asset prices, but not so much for the economy as shown above. In other words, QE was ultimately a massive “wealth transfer” from the middle class to the rich which has created one of the greatest wealth gaps in the history of the U.S., not to mention an asset bubble of historic proportions.
But Will It Work Next Time?
This is the single most important question for investors.
The current belief is that QE4 will be implemented at the first hint of a more protracted downturn in the market. However, as we noted above, QE will likely only be employed when rate reductions aren’t enough. Such was noted in 2016 by David Reifschneider, deputy director of the division of research and statistics for the Federal Reserve Board in Washington, D.C., released a staff working paper entitled “Gauging The Ability Of The FOMC To Respond To Future Recessions.”
The conclusion was simply this:
“Simulations of the FRB/US model of a severe recession suggest that large-scale asset purchases and forward guidance about the future path of the federal funds rate should be able to provide enough additional accommodation to fully compensate for a more limited [ability] to cut short-term interest rates in most, but probably not all, circumstances.”
In other words, the Federal Reserve is rapidly becoming aware they have become caught in a liquidity trap keeping them unable to raise interest rates sufficiently to reload that particular policy tool. There are certainly growing indications, as discussed recently, the U.S. economy maybe be heading towards the next recession.
Interestingly, David compared three policy approaches to offset the next recession.
- Fed funds goes into negative territory but there is no breakdown in the structure of economic relationships.
- Fed funds returns to zero and keeps it there long enough for unemployment to return to baseline.
- Fed funds returns to zero and the FOMC augments it with additional $2-4 Trillion of QE and forward guidance.
In other words, the Fed is already factoring in a scenario in which a shock to the economy leads to additional QE of either $2 trillion, or in a worst-case scenario, $4 trillion, effectively doubling the current size of the Fed’s balance sheet.
Here is what is interesting, as reported by Jennifer Ablan:
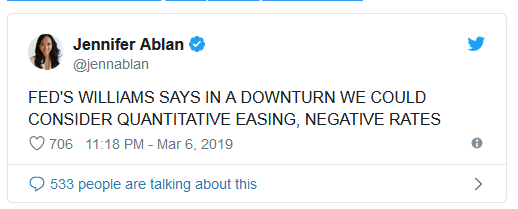
So, 2-years ago David lays out the plan and yesterday Williams (NYSE:WMB) reiterates that plan.
Does the Fed see a recession on the horizon? Is this the reason for the sudden change in views by Powell in recent weeks?
Maybe.
But there is a problem with the entire analysis. The effectiveness of QE, and zero interest rates, is based on the point at which you apply these measures. This was something I pointed out previously:
“In 2008, when the Fed launched into their “accommodative policy” emergency strategy to bail out the financial markets, the Fed’s balance sheet was only about $915 Billion. The Fed Funds rate was at 4.2%.
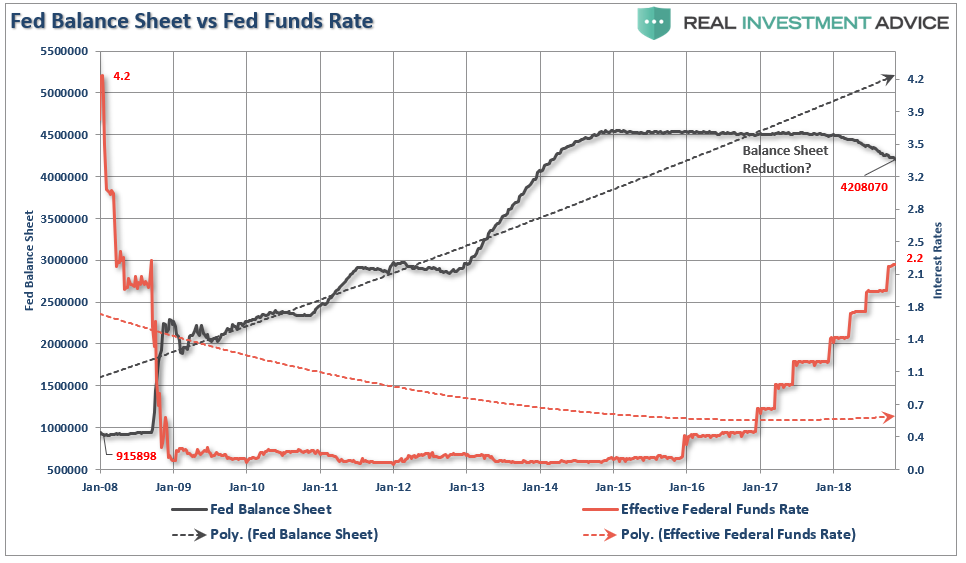
If the market fell into a recession tomorrow, the Fed would be starting with roughly a $4 Trillion balance sheet with interest rates 2% lower than they were in 2009. In other words, the ability of the Fed to ‘bail out’ the markets today, is much more limited than it was in 2008.”
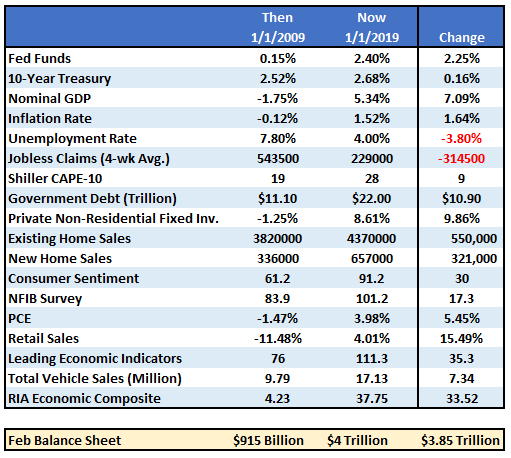
But there is more to the story than just the Fed’s balance sheet and funds rate. The entire backdrop is completely reversed. The table below compares a variety of financial and economic factors from 2009 to present.
The critical point here is that QE and rate reductions have the MOST effect when the economy, markets, and investors have been “blown out,” deviations from the “norm” are negatively extended, confidence is hugely negative.
In other words, there is nowhere to go but up.
Such was the case in 2009. Even without Federal Reserve interventions, it is highly probable that the economy would have begun a recovery as the normal economic cycle took hold. No, the recovery would not have been as strong, and asset prices would be about half of where they are today, but an improvement would have happened nonetheless.
The extremely negative environment that existed, particularly in the asset markets, provided a fertile starting point for monetary interventions. Today, as shown in the table above, the economic and fundamental backdrop could not be more diametrically opposed.
This suggests that the Fed’s ability to stem the decline of the next recession, or offset a financial shock to the economy from falling asset prices, may be much more limited than the Fed, and most investors, currently believe.
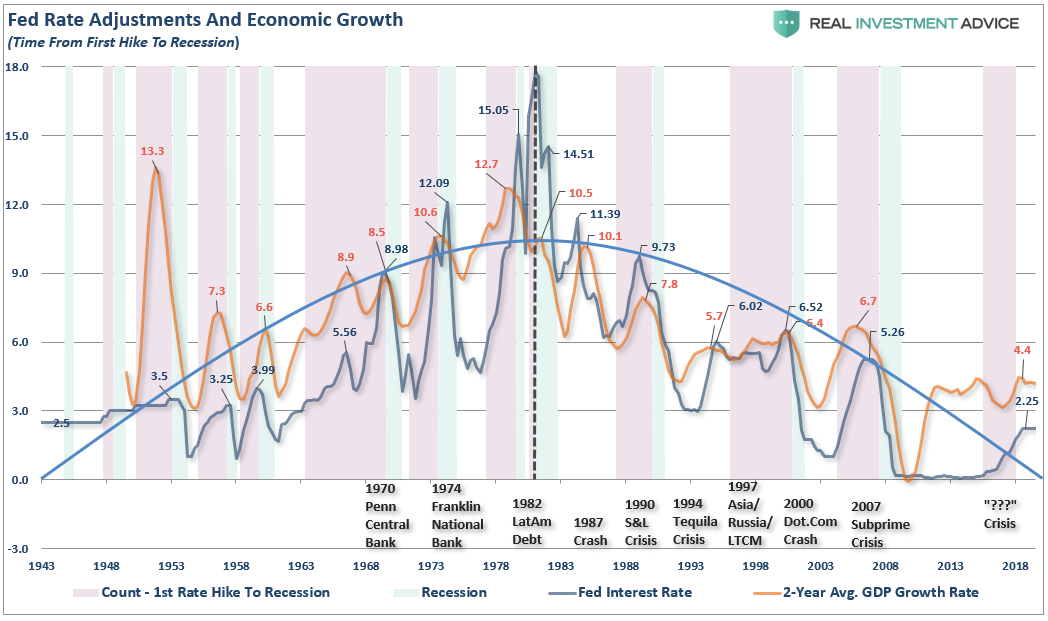
The Fed’s hope has always been that at some point they would be able to wean the economy off of life support and it would operate under its own strength. This would allow the Fed to raise interest rates back to more normalized levels and provide a policy tool to offset the next recession. However, given the Fed has never been able to get rates higher than the last crisis, it has only led to bigger “booms and busts” in recent decades.
Summary
It has taken a massive amount of interventions by Central Banks to keep economies afloat globally over the last decade and there is rising evidence that growth is beginning to decelerate.
While another $2-4 Trillion in QE might indeed be successful in further inflating the third bubble in asset prices since the turn of the century, there is a finite ability to continue to pull forward future consumption to stimulate economic activity. In other words, there are only so many autos, houses, etc., which can be purchased within a given cycle. There is evidence the cycle peak has been reached.
If I am correct, and the effectiveness of rate reductions and QE are diminished due to the reasons detailed herein, the subsequent destruction to the “wealth effect” will be far larger than currently imagined. There is a limit to just how many bonds the Federal Reserve can buy and a deep recession will likely find the Fed powerless to offset much of the negative effects.
If more “QE” works, great. But as investors, with our retirement savings at risk, what if it doesn’t.

