Let’s determine the stock market’s most probable medium-term direction by objectively quantifying technical analysis. For reference, here’s the random probability of the U.S. stock market going up on any given day.

*Probability ≠ certainty. Past performance ≠ future performance. But if you don’t use the past as a guide, you are blindly “guessing” the future.
Who’s leading the rally?
Taking a quick look at the stock market’s internals, it’s clear who’s leading/lagging.
Here’s the Russell 2000 (small caps). Lagging.

Here’s XLK (tech ETF) and the NASDAQ 100. Leading.


Veteran traders may see this as a bearish sign because “this is how the dot-com bubble played out”. Tech stocks soared while small caps and value stocks underperformed

One of the human brain’s biggest problems is that we tend to remember extreme cases more clearly than less extreme cases. E.g. everyone remembers 2008, but how many people remember 2010, 2011, 2012, 2013, 2014.
This is why we need data. Data looks at all the historical cases holistically to get a broad view as to how bullish/bearish something really is.
This is what happened next to the S&P when the NASDAQ 100 rallied more than 6% over the past 27 days while the Russell falls more than -1.5%
*Data from 1985 – present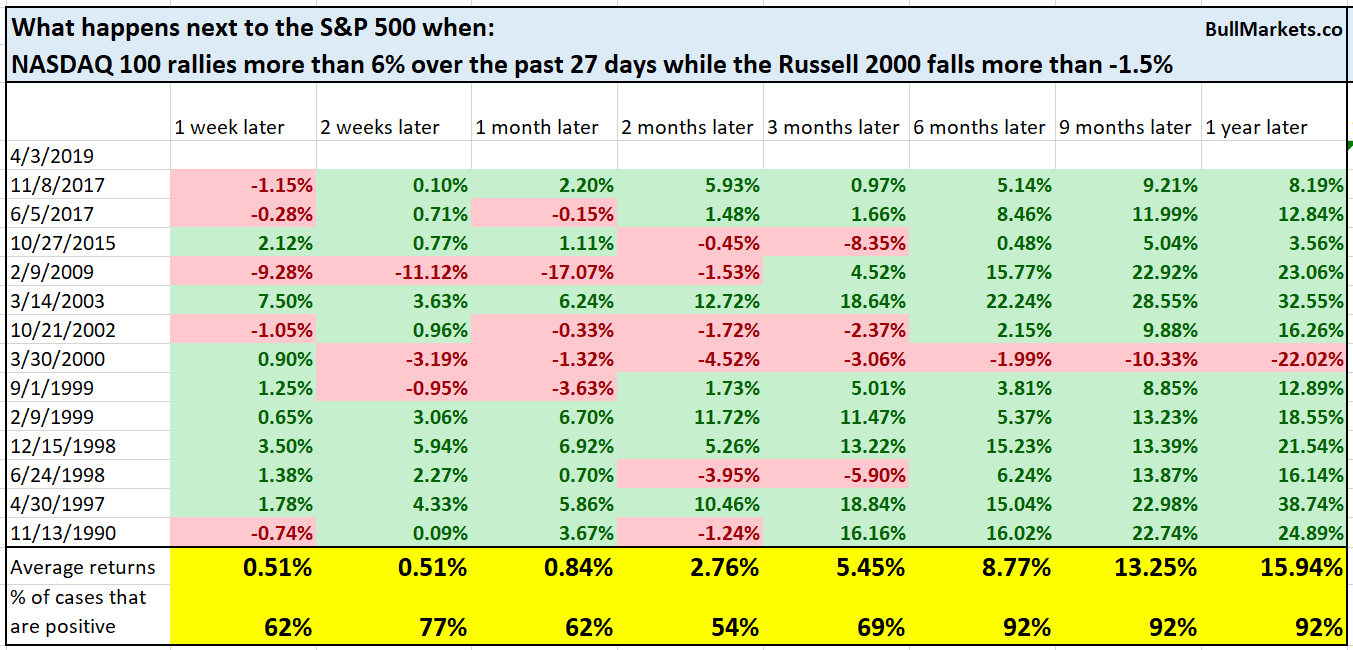
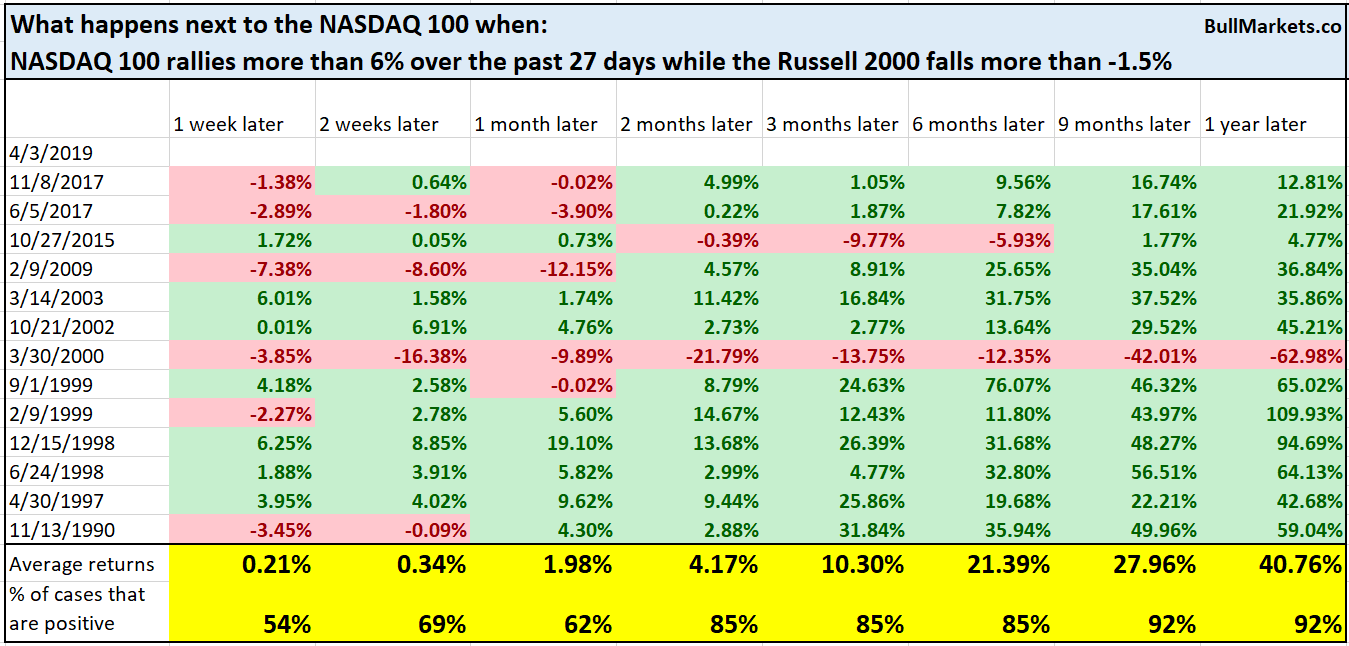
Here’s what happens next to the NASDAQ 100:
Here’s what happens next to the Russell 2000:
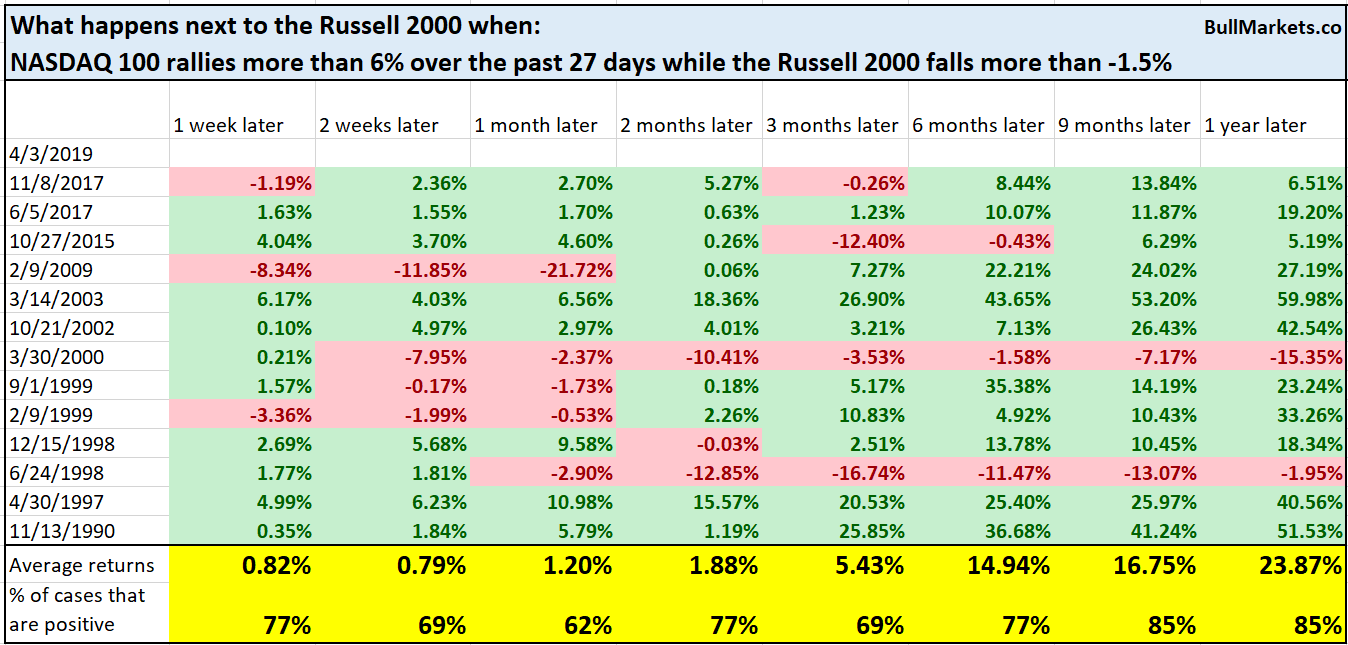
Yes, this did happen during the dot-com bubble (see the year 2000 case). But most of the time, this was bullish for stocks 6-12 months later.
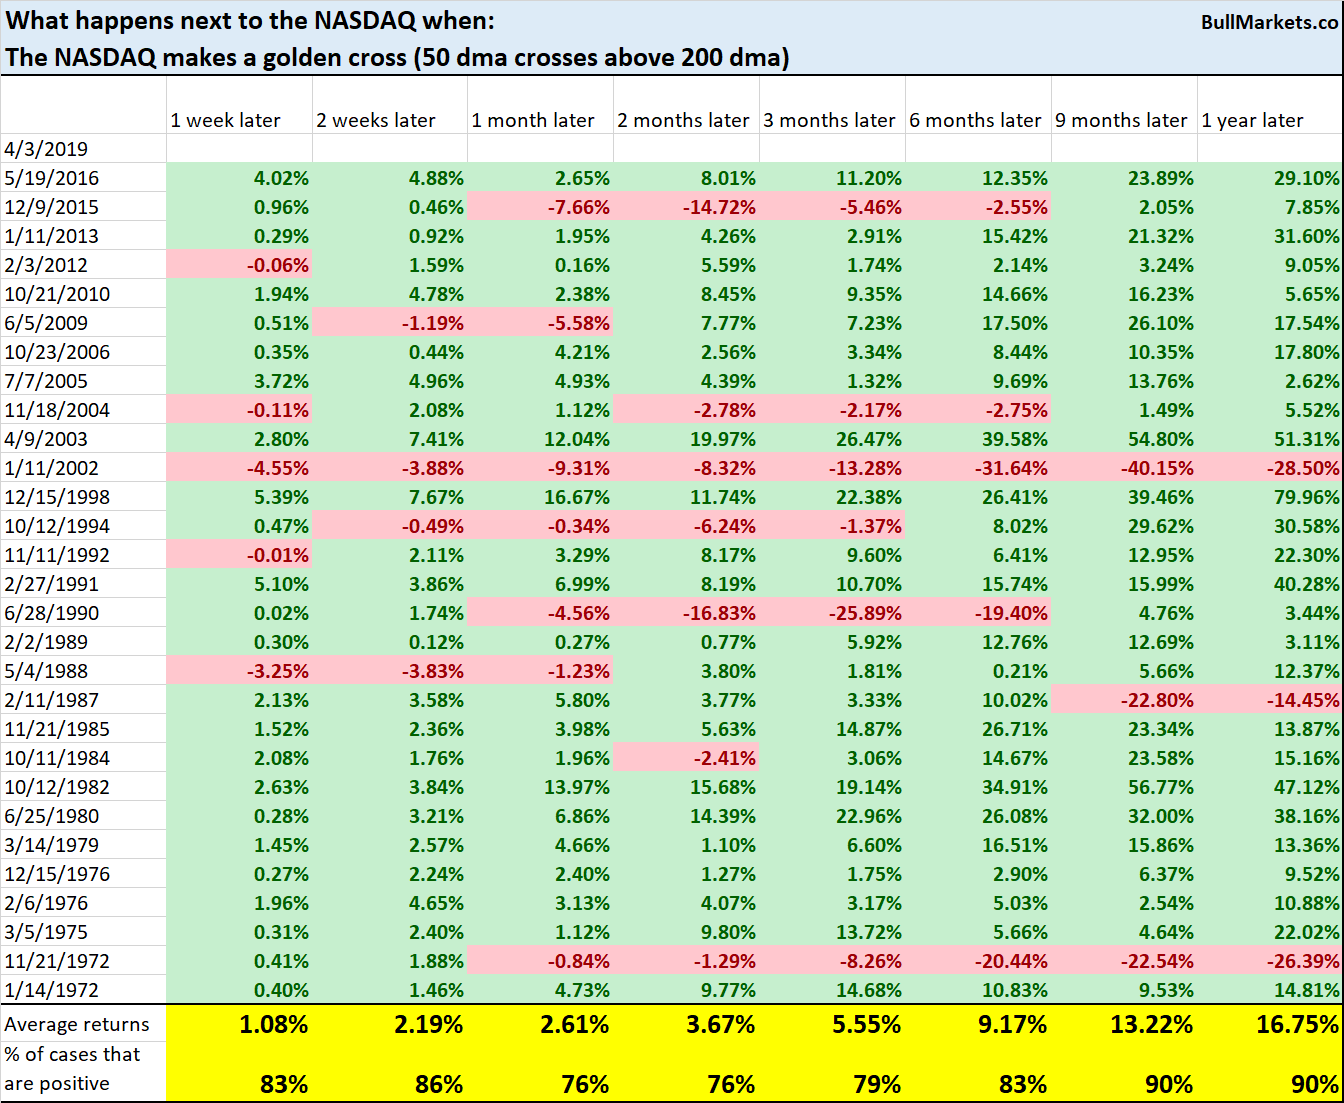
NASDAQ Golden Cross
The NASDAQ Composite made a “golden cross” today, whereby its 50 DMA crossed above its 200 DMA.

I demonstrated before that the S&P’s golden crosses aren’t as consistently bullish over the next year.
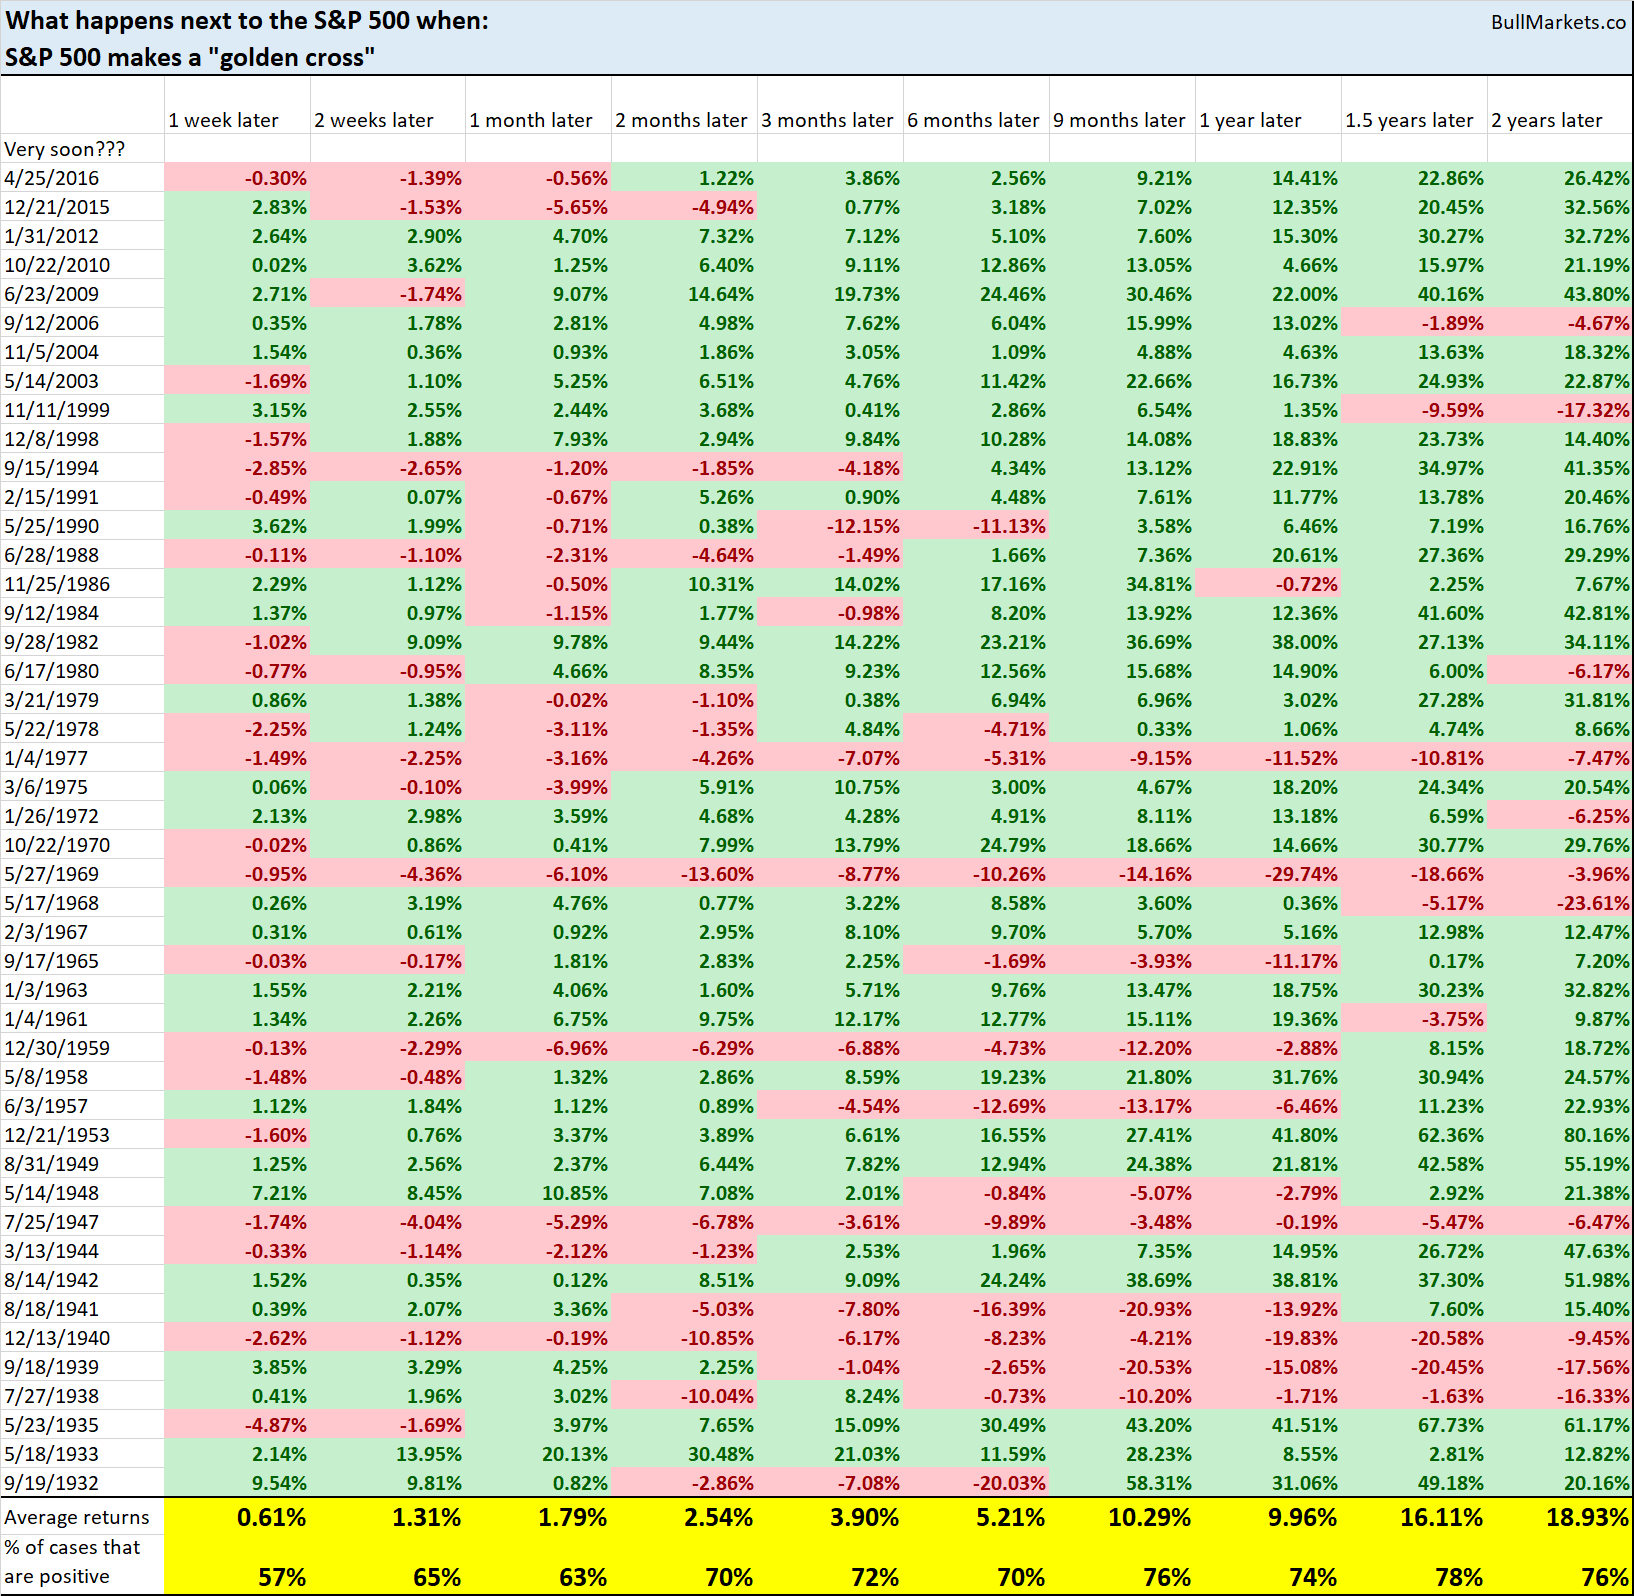
But did you know that the NASDAQ’s golden crosses are more consistently bullish than the S&P’s golden crosses? See the NASDAQ’s 6-12 month forward returns.
Why the disparity?
The S&P tends to be more choppy than the NASDAQ. Since the NASDAQ is loaded with high-flying tech stocks, it’s similar to being a high beta version of the S&P. In fact, the NASDAQ’s daily fluctuations are approximately 1.2x that of the S&P’s daily fluctuations.
Trend following indicators (e.g. golden crosses and death crosses) work better in markets that go straight up and straight down (i.e. have clearer trends). Trend following indicators work more poorly in choppier markets.
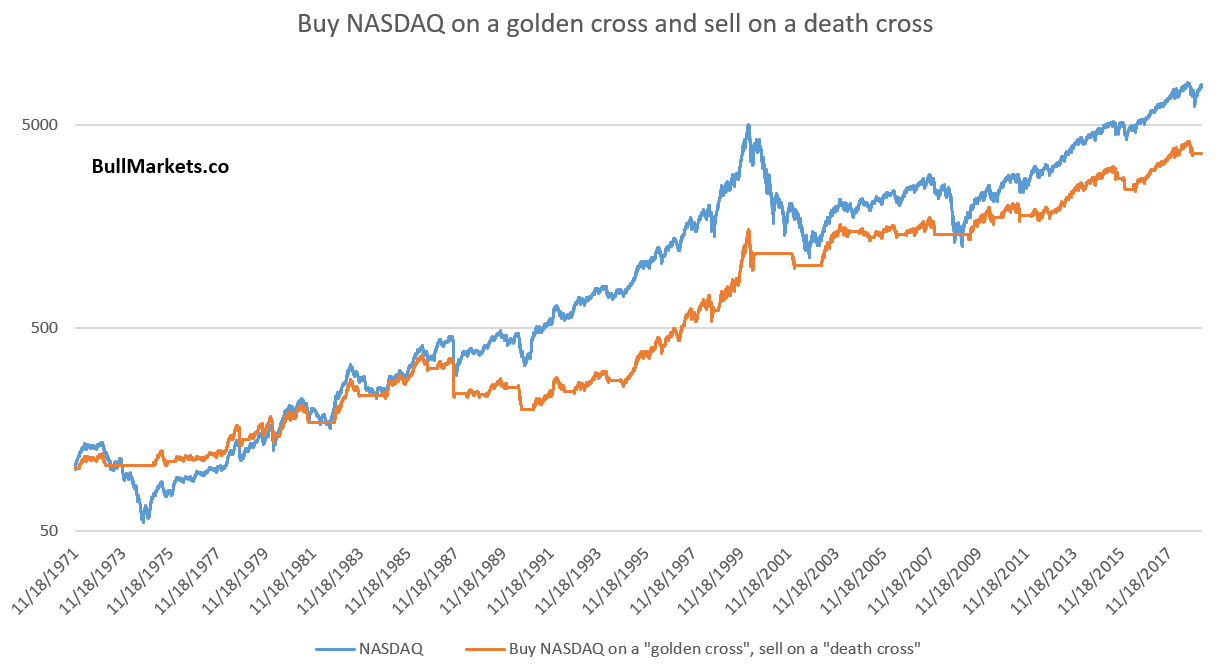
Nevertheless, here’s what happens when you buy NASDAQ on a “golden cross” and sell on a “death cross” (50 DMA breaks below 200 DMA).
Yes, many of the famous and popular technical indicators don’t beat buy and hold.
 Gap
Gap
Traditional technical analysis books pay a lot of attention to gaps. There are different ways of interpreting gaps, but the general idea is that “gaps should be filled.”
The S&P 500 gapped up today and then fell from the OPEN to CLOSE. Is this an example of “fading the gap”?

Here’s what happens next to the S&P when it gaps up more than 0.4% and then falls more than -0.2% from the OPEN to CLOSE.

Quite bullish 1 year later, but I wouldn’t use a 1-day candlestick to predict the stock market’s 1 year forward returns.
Let’s examine the cases only when the S&P was above its 200 DMA.
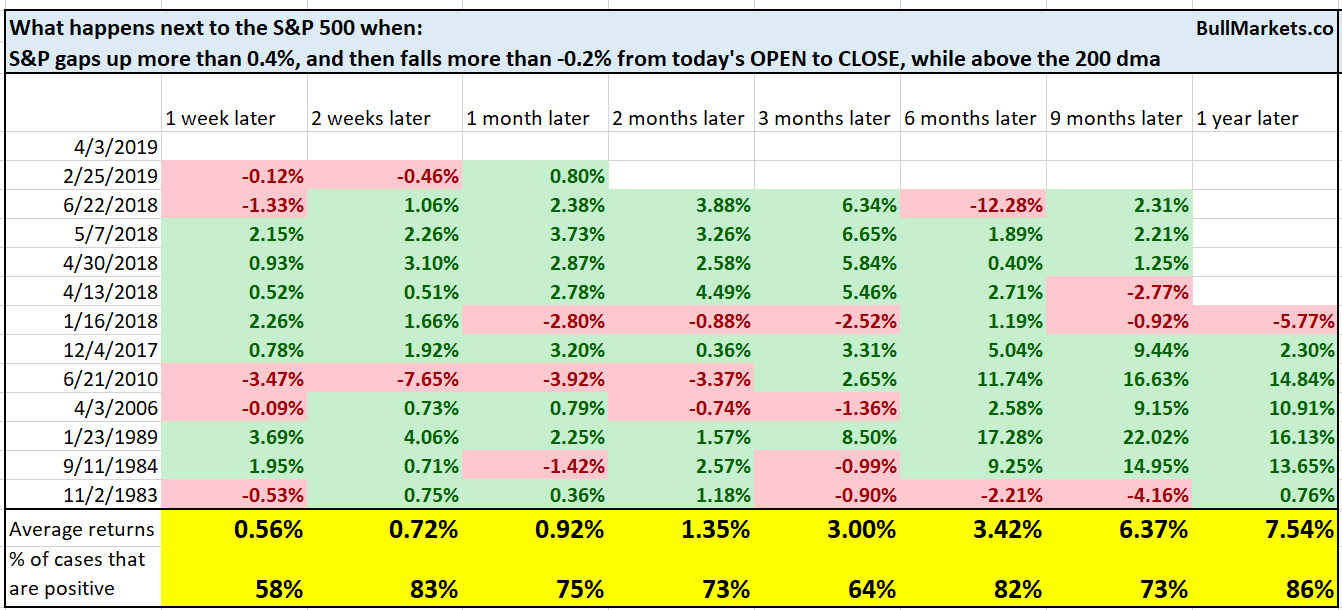
In this case, we can see a slight bullish lean over the next 2 weeks. But remember: the short term is extremely hard to predict. No matter how much conviction you think you have, you can always be wrong.
Citigroup Economic Surprise Index (again)
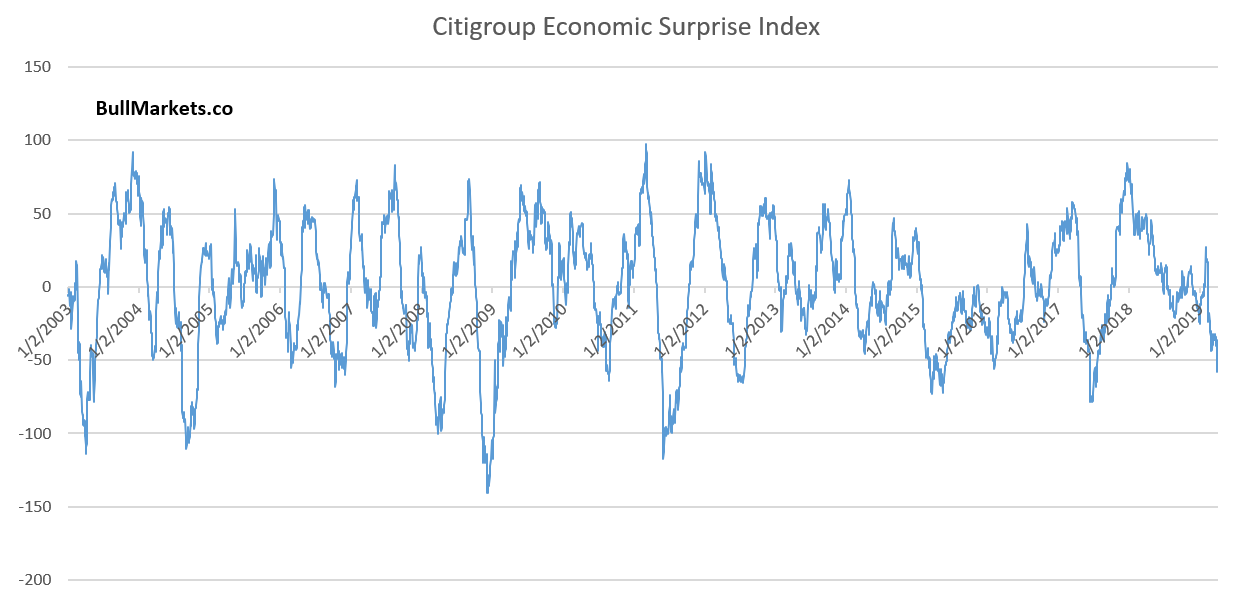
The Citigroup Econoimc Surprise Index is quite a popular economic indicator, probably because by design it is supposed to “crash” once or twice a year (good for hyping that fear in the media and social media.)
The Citigroup Economic Surprise Index is making new lows compared to when we discussed it last week.
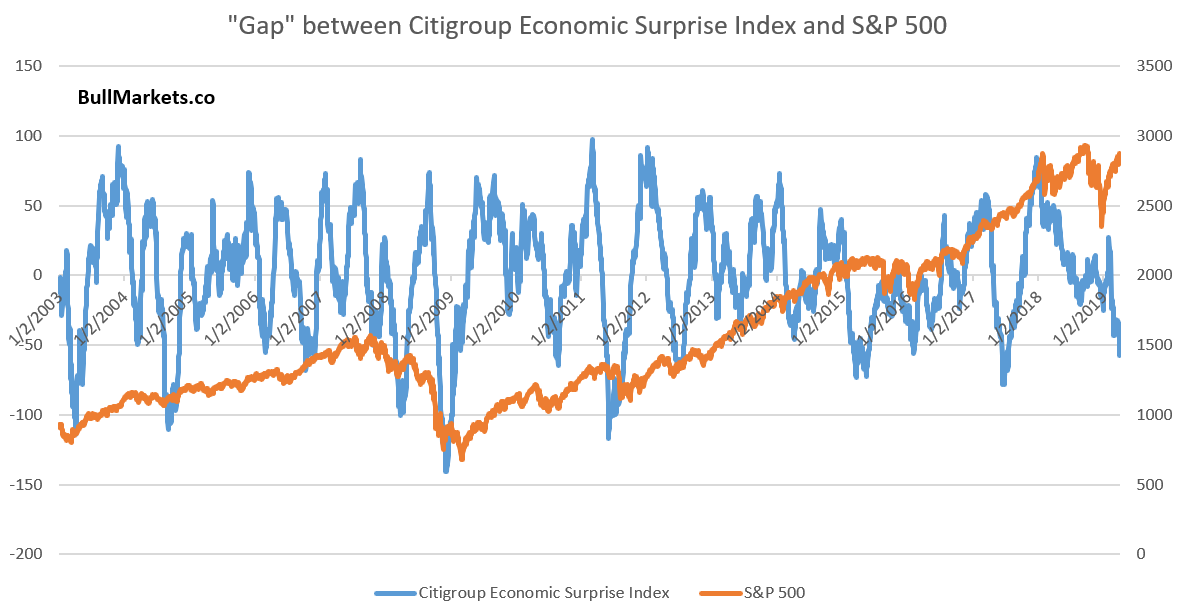
The following chart looks scary, doesn’t it? “The last time the gap between the Citigroup Economic Surprise Index and S&P was this big, it was September 2018”.
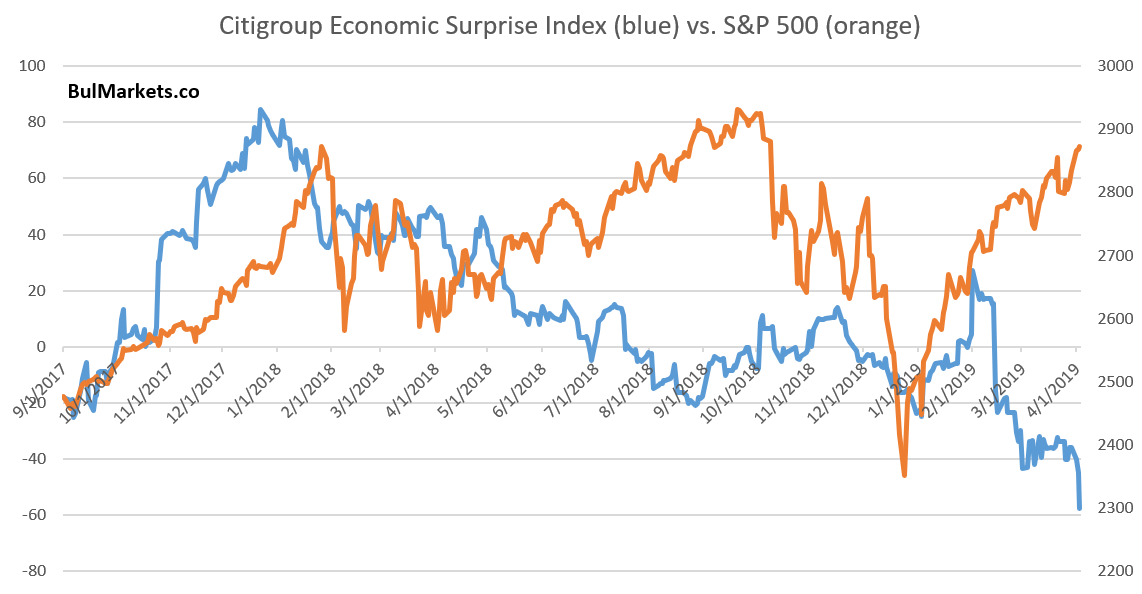
Here’s the thing. This “gap” doesn’t make any sense. It’s an optical illusion. The 2 scales are completely different, and by design, the Citigroup Economic Surprise Index is supposed to swing within a range.
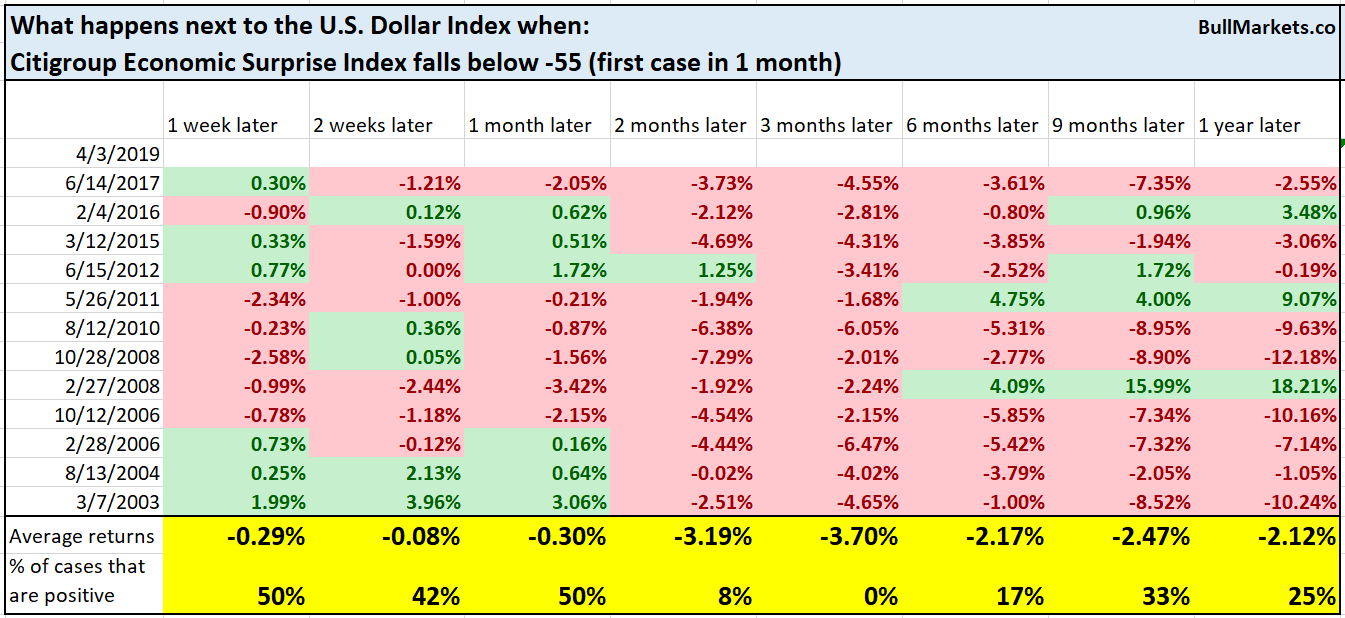
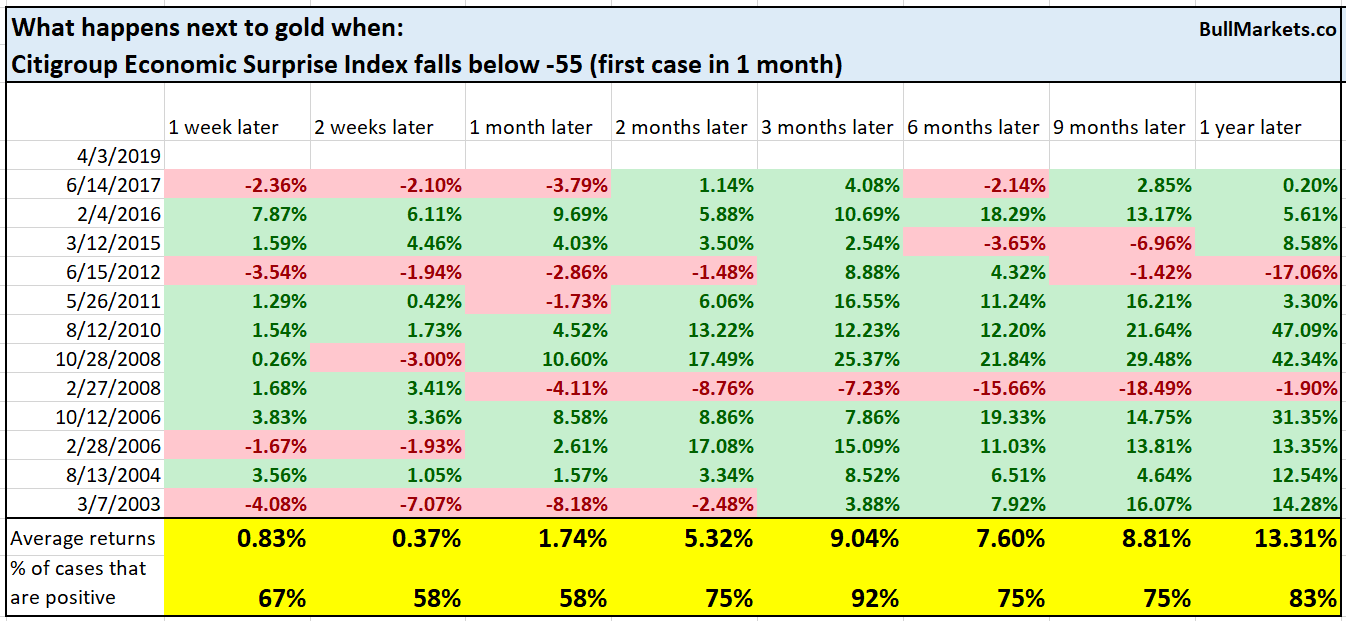
Here’s what happens next to the S&P when the Citigroup Economic Surprise Index is under -55
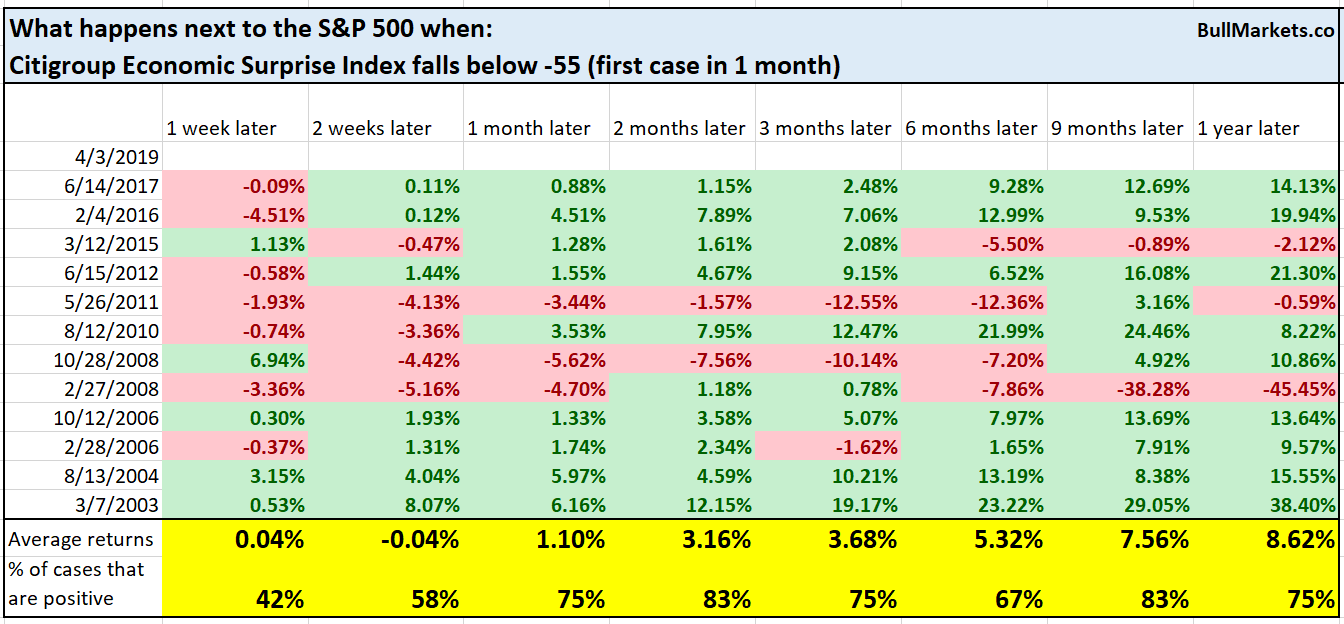
As we’ve said in the past, the Citigroup Economic Surprise Index doesn’t measure the state of the economy. It merely measures the state of economic data versus analysts’ expectations. Reality vs. expectation is a cycle. When reality constantly disappoints expectation, it will likely soon start to beat expectations.
Here’s what happens next to the USD Index
Here’s what happens next to gold
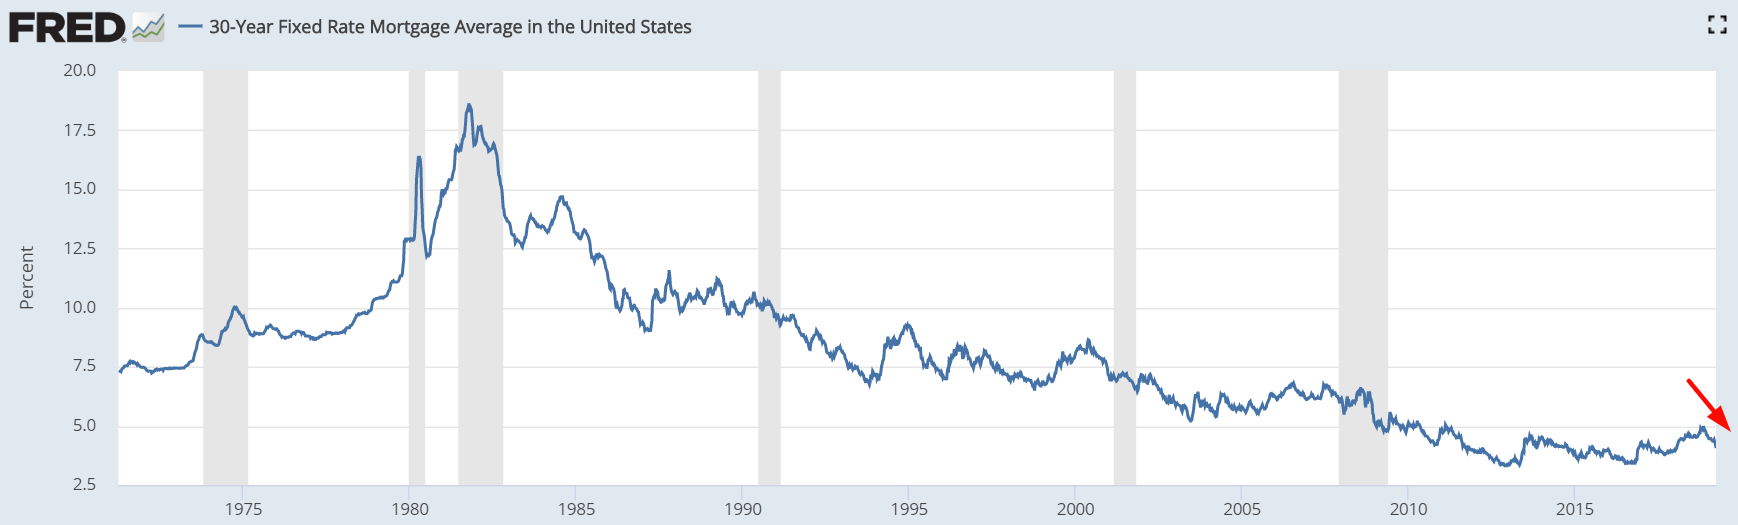
Mortgages
Mortgage rates are falling. (Do you remember how everyone was afraid of rising interest rates in 2018? Today, everyone is afraid of falling interest rates. No matter what happens, there is always something to “worry about”).
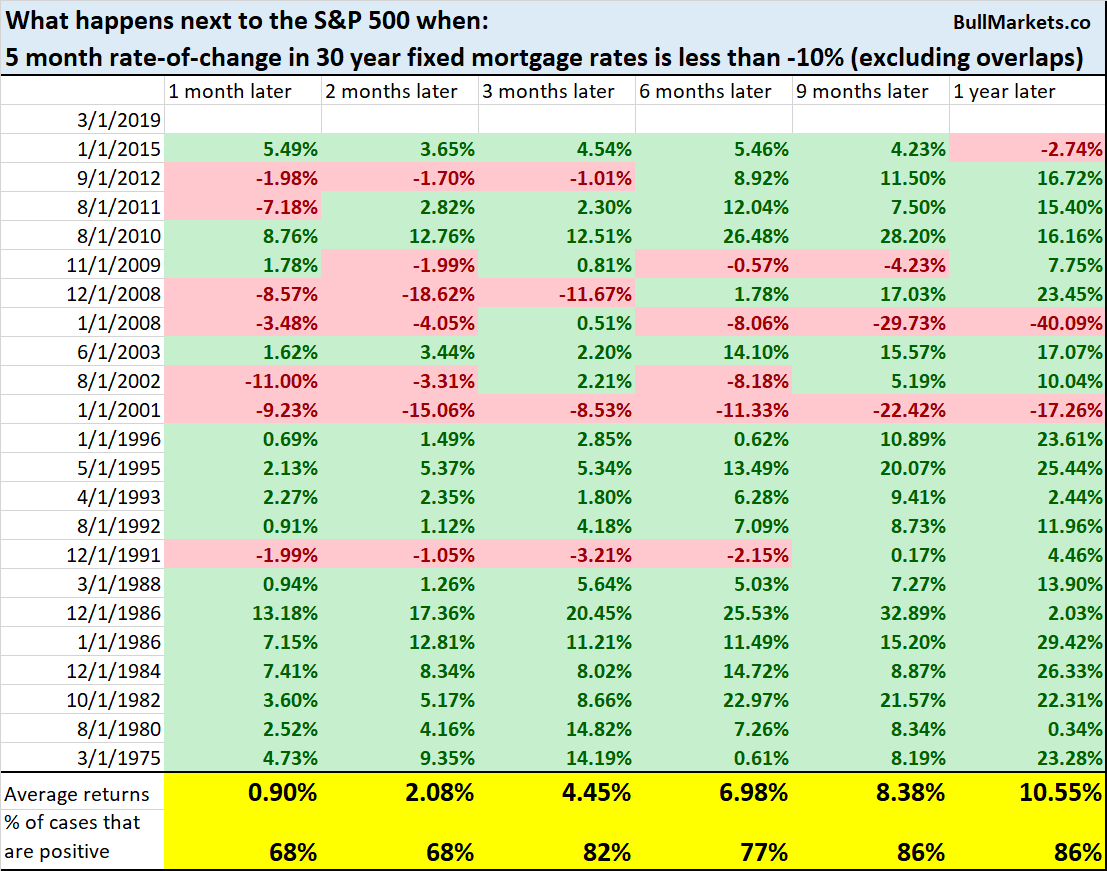
Here’s the 5-month rate-of-change in 30 year fixed mortgages. You can see that this figure is quite low.
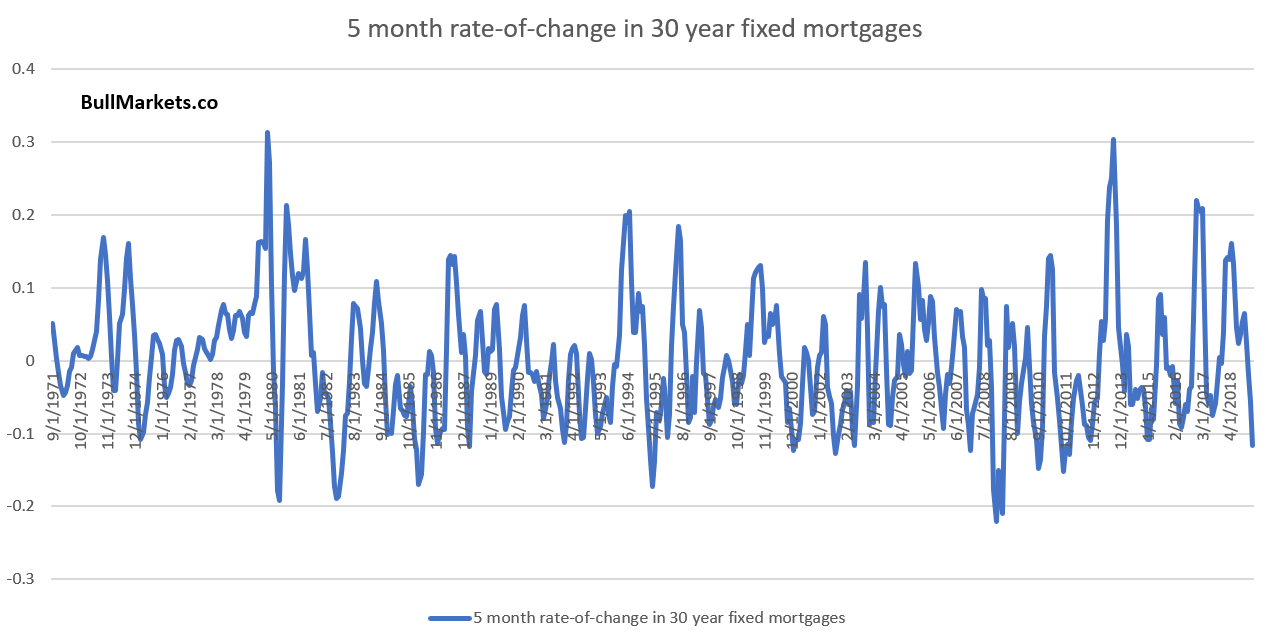
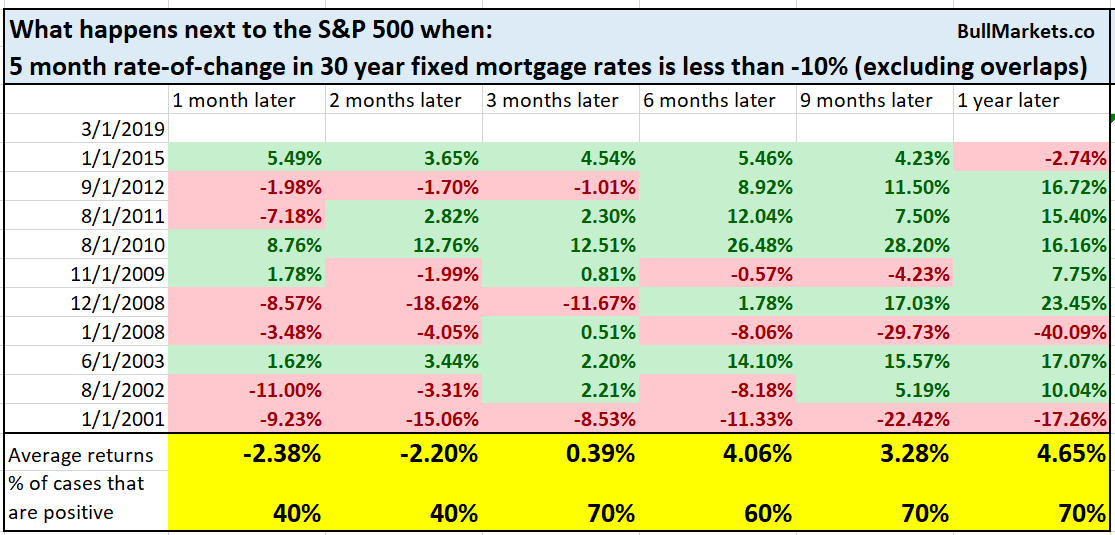
Here’s what happens next to the S&P when the 5 month rate-of-change falls below -10%
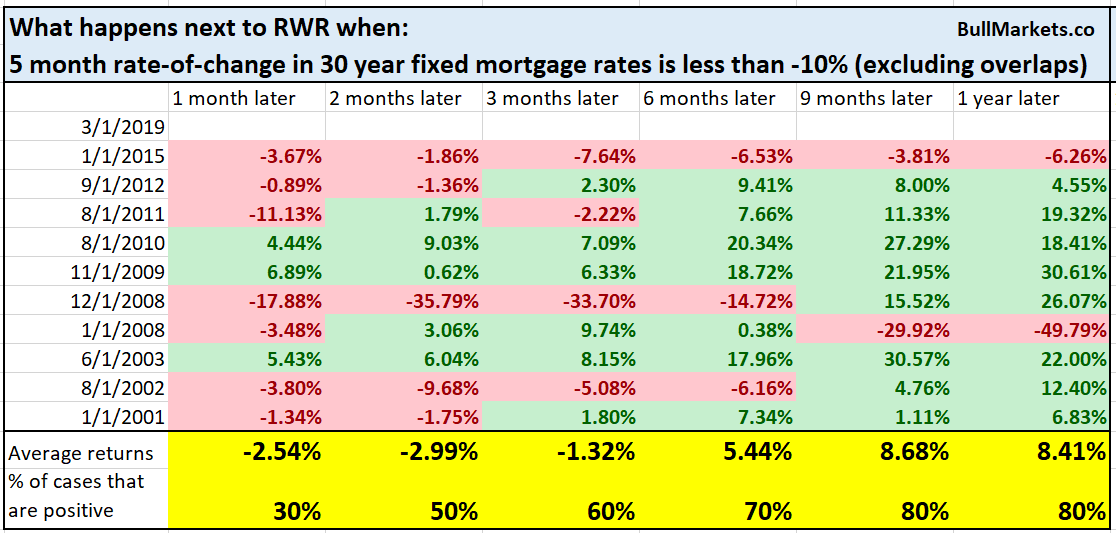
This is actually more bullish for real estate than stocks. Let’s compare the historical cases for the S&P against the historical cases for RWR (REIT ETF)
The next one
A lot of traders are thinking about “the next one”. You know the drill – “economic expansion is aged, corporate profit growth is falling, the bull market has lasted TOO long, debt buildup, central bank intervention…..”
But as I’ve said before, I don’t think the next recession and bear market will be “just like 2008” (or even as bad as 2008).
Consider this fact.
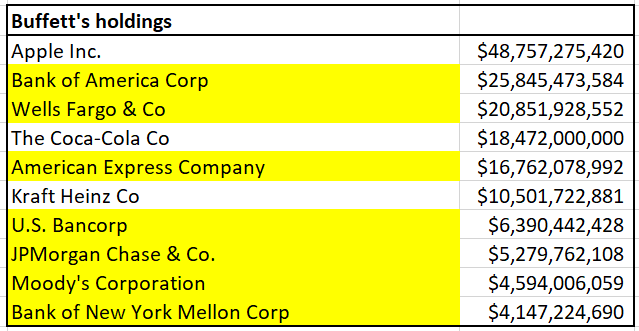
Warren Buffett has a stock portfolio of $203 billion (from CNBC)
Of his top 10 holdings, 7 of them are financial stocks. These 7 stocks alone account for 41% of Buffett’s equities portfolio (not including the smaller positions he has in other financial stocks). In total, approximately 61% of Buffett’s portfolio is in financial stocks. That’s a very strong bias towards the finance sector, which has a weight of just 15% in the S&P 500
If the “next one” were just as bad or “just like 2008”, do you think Buffett would be going heavily long bank stocks? He knows far more than you and I about the inner workings of companies and their financial statements. Buffett sold many of his financial stocks long before the 2007/2008 crash because he was concerned about the debt buildup in banks. He only bought financial stocks AFTER they crashed in 2008.
Compared to 2007/2008, financial companies have lower leverage ratios today than they used to have. Moreover, financial companies have low valuations (Buffett buys value stocks. Buffett’s portfolio has an average P/E ratio of 14.6, which is 1/3 less than the S&P’s P/E ratio).
Conclusion
Here is our discretionary market outlook:
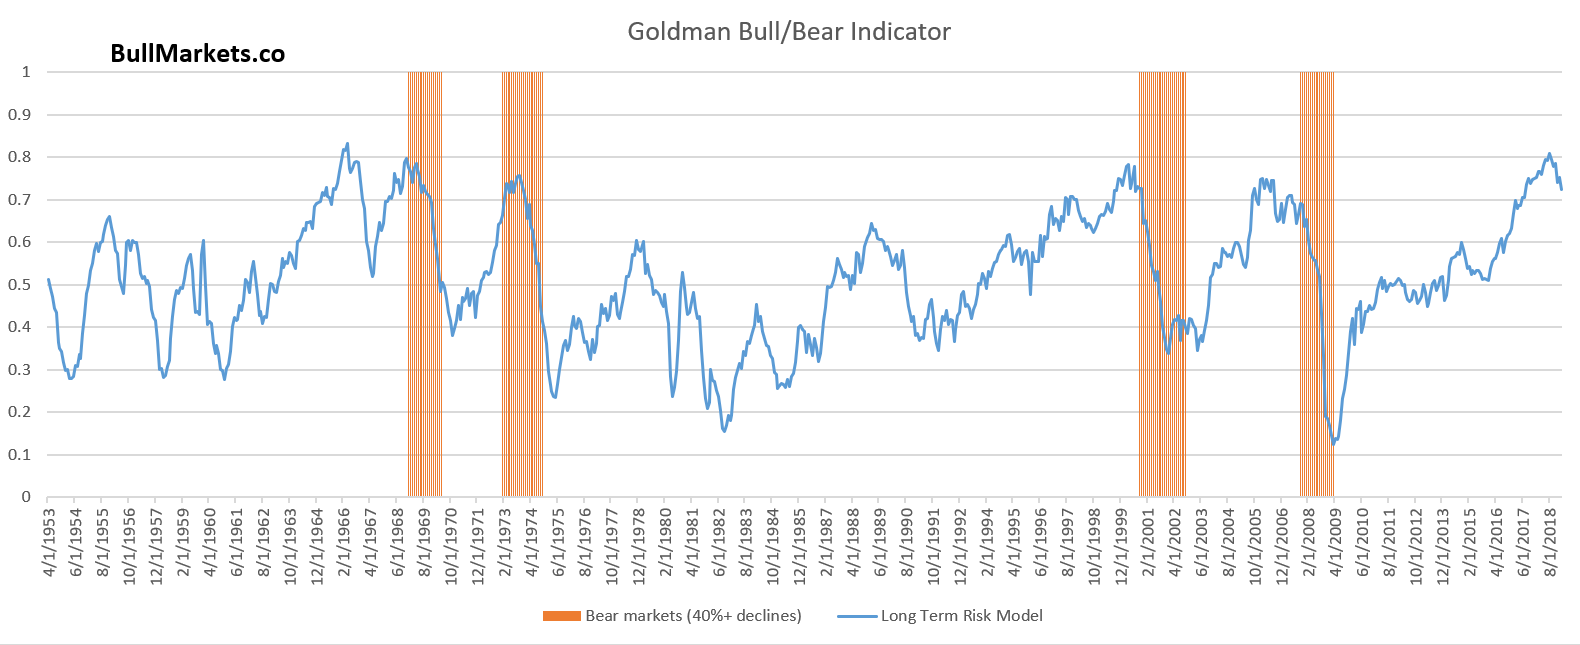
- The U.S. stock market’s long term risk: reward is no longer bullish. In a most optimistic scenario, the bull market probably has 1 year left. Long term risk: reward is more important than trying to predict exact tops and bottoms.
- The medium-term direction (e.g. next 6-9 months) is mostly mixed, although there is a bullish lean.
Goldman Sachs’ Bull/Bear Indicator demonstrates that risk: reward does favor long term bears.