During my morning reading, I ran across an interesting article from Paul Lim via Time giving several reasons why the stock market will “rise for a ninth straight year.”
For ordinary Americans, 2017 is likely to feel like the best year economically since the Great Recession.
The recovery is finally expected to trickle down to you in the form of an improved job market, higher wages, and growing spending power.
And, despite the advanced age of this bull, your improving fortunes just may keep U.S. stocks chugging along too, as consumers represent 70% of the U.S. economy.
While his points are valid, but very debatable, it is critical to remember the stock market and the economy are two different things. GDP growth and stock returns are not highly correlated. In fact, some analysis suggests that they are negatively correlated and perhaps fairly strongly so (-0.40).
However, it isn’t just Paul pushing the bullish commentary, but virtually the entirety of the media press. The siren’s song of “stay long my friends” has risen as of late as the market has soared following the election. But here is the interesting takeaway:
The reasoning for the continuance of the “bull rally” over the last several years has been footed by the common threads of:
- Interest rates and inflation are low,
- Corporate profitability is high,
- Economic recovery is stronger than it looks and;
- Global Central Bank interventions continue to put a floor under stocks.
Now, the bull market will continue because:
- Interest rates and inflation are rising,
- Corporate profitability will rise,
- The economic recovery will strengthen, and;
- Global Central Bank interventions/supports are being removed.
It Can’t Be Both.
Interest rates have remained low because of the Federal Reserve’s actions and weak economic growth rates, corporate profitability is high due to accounting gimmicks, and the Fed’s liquidity programs have artificially inflated stock prices. As far as the economy goes, I think it looks like it looks.
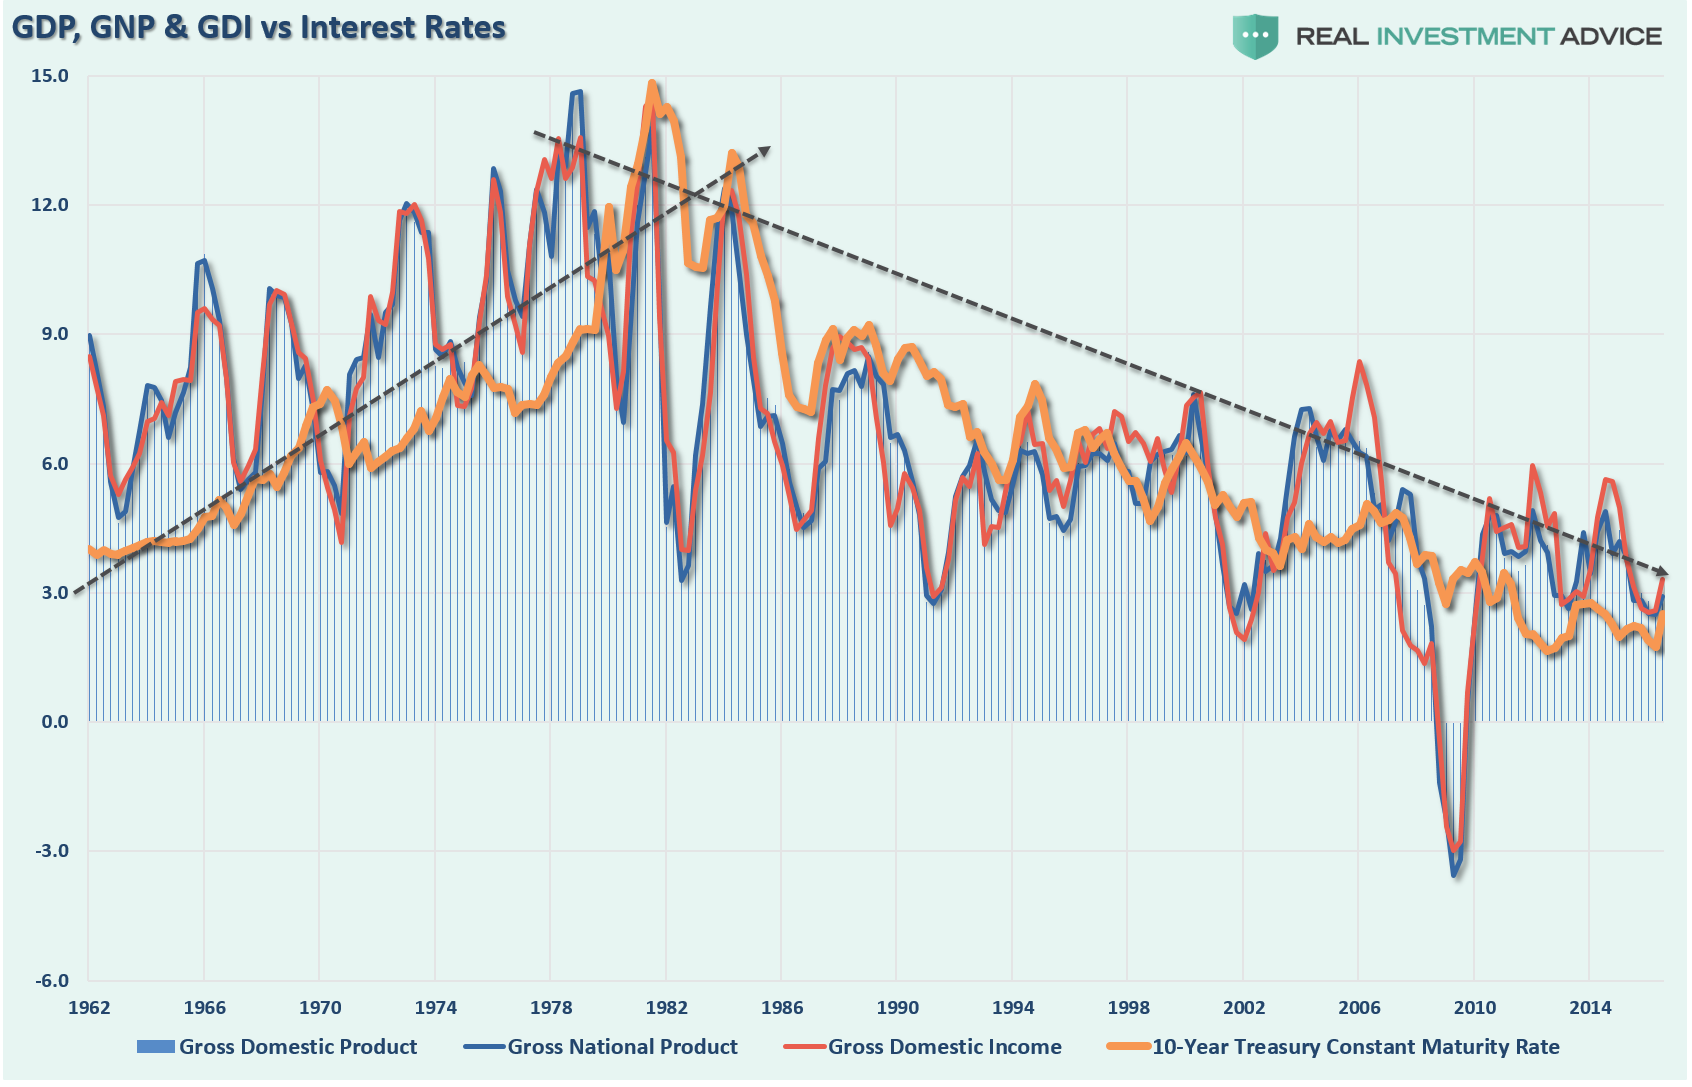
Yes, there are lots of wiggles along the way. Each bounce was expected to be “the turn” into a lasting uptrend with respect to policy changes, etc. They weren’t. Debt has continued to erode the underlying ability for economic growth to accelerate and with interest rates rising, the negative feedback loop will likely manifest itself sooner than most expect.
However, in the meantime, the promise of a continued bull market is very enticing. But it is important for investors to remember we have only one job: “Buy Low/Sell High.” It is a simple rule that is often forgotten as “greed” replaces “logic.” It is also that simple emotion of greed that tends to lead to devastating losses. Therefore, if your portfolio, and ultimately your retirement, is dependent upon the thesis of a continued bull market, you should at least consider the following charts which cover both fundamental and technical views.
Valuations
I have often visited the point of valuations and the importance of them. Valuations are often dismissed in the short-term because there is not an immediate impact on price returns. Valuations, by their very nature, are HORRIBLE predictors of 12-month returns should not be used in any strategy that has such a focus. However, in the longer term, valuations are strong predictors of expected returns.
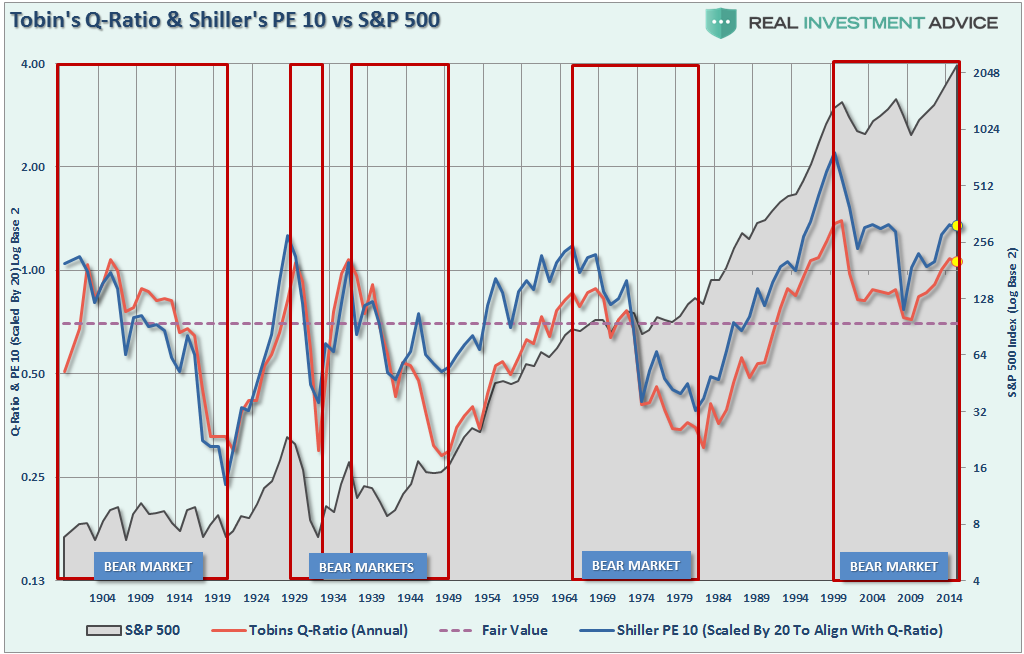
The chart below shows Dr. Robert Shiller’s cyclically adjusted P/E ratio combined with Tobin’s Q-ratio. The problem is that current valuations only appear cheap when compared to the peak in 2000. Outside of that exception, the financial markets are now more expensive than at any other point in history.
I have often posted the following chart, which shows current valuations that suggest very low 20-year total returns.
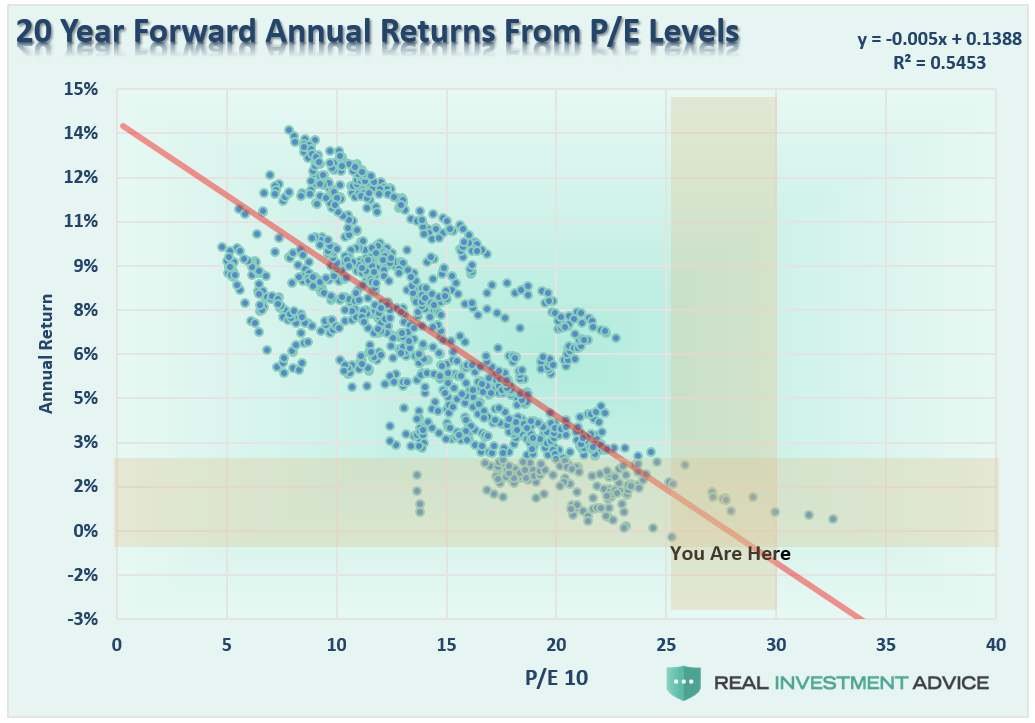
Not exactly the return that most of the bullish media is suggesting currently.
Sentiment
Another argument for the continuation of the current “bull market” remains the “cash on the sidelines” that will come rushing in just any day now. As Cliff Asness, head of AQR Capital, penned:
Every time someone says, ‘There is a lot of cash on the sidelines,’ a tiny part of my soul dies. There are no sidelines. Those saying this seem to envision a seller of stocks moving her money to cash and awaiting a chance to return. But they always ignore that this seller sold to somebody, who presumably moved a precisely equal amount of cash off the sidelines.
Cliff, of course, is right. However, the other argument is that retail investors “missed out on the bull market” and will push stocks higher as they move back into the markets. That is not the case either.
The chart below shows the percentage of stocks, bonds and cash owned by individual investors according to the American Association of Individual Investor’s survey. With equity ownership approaching the highest levels since 2007, and near record low levels of cash, the individual investor is “all in.”
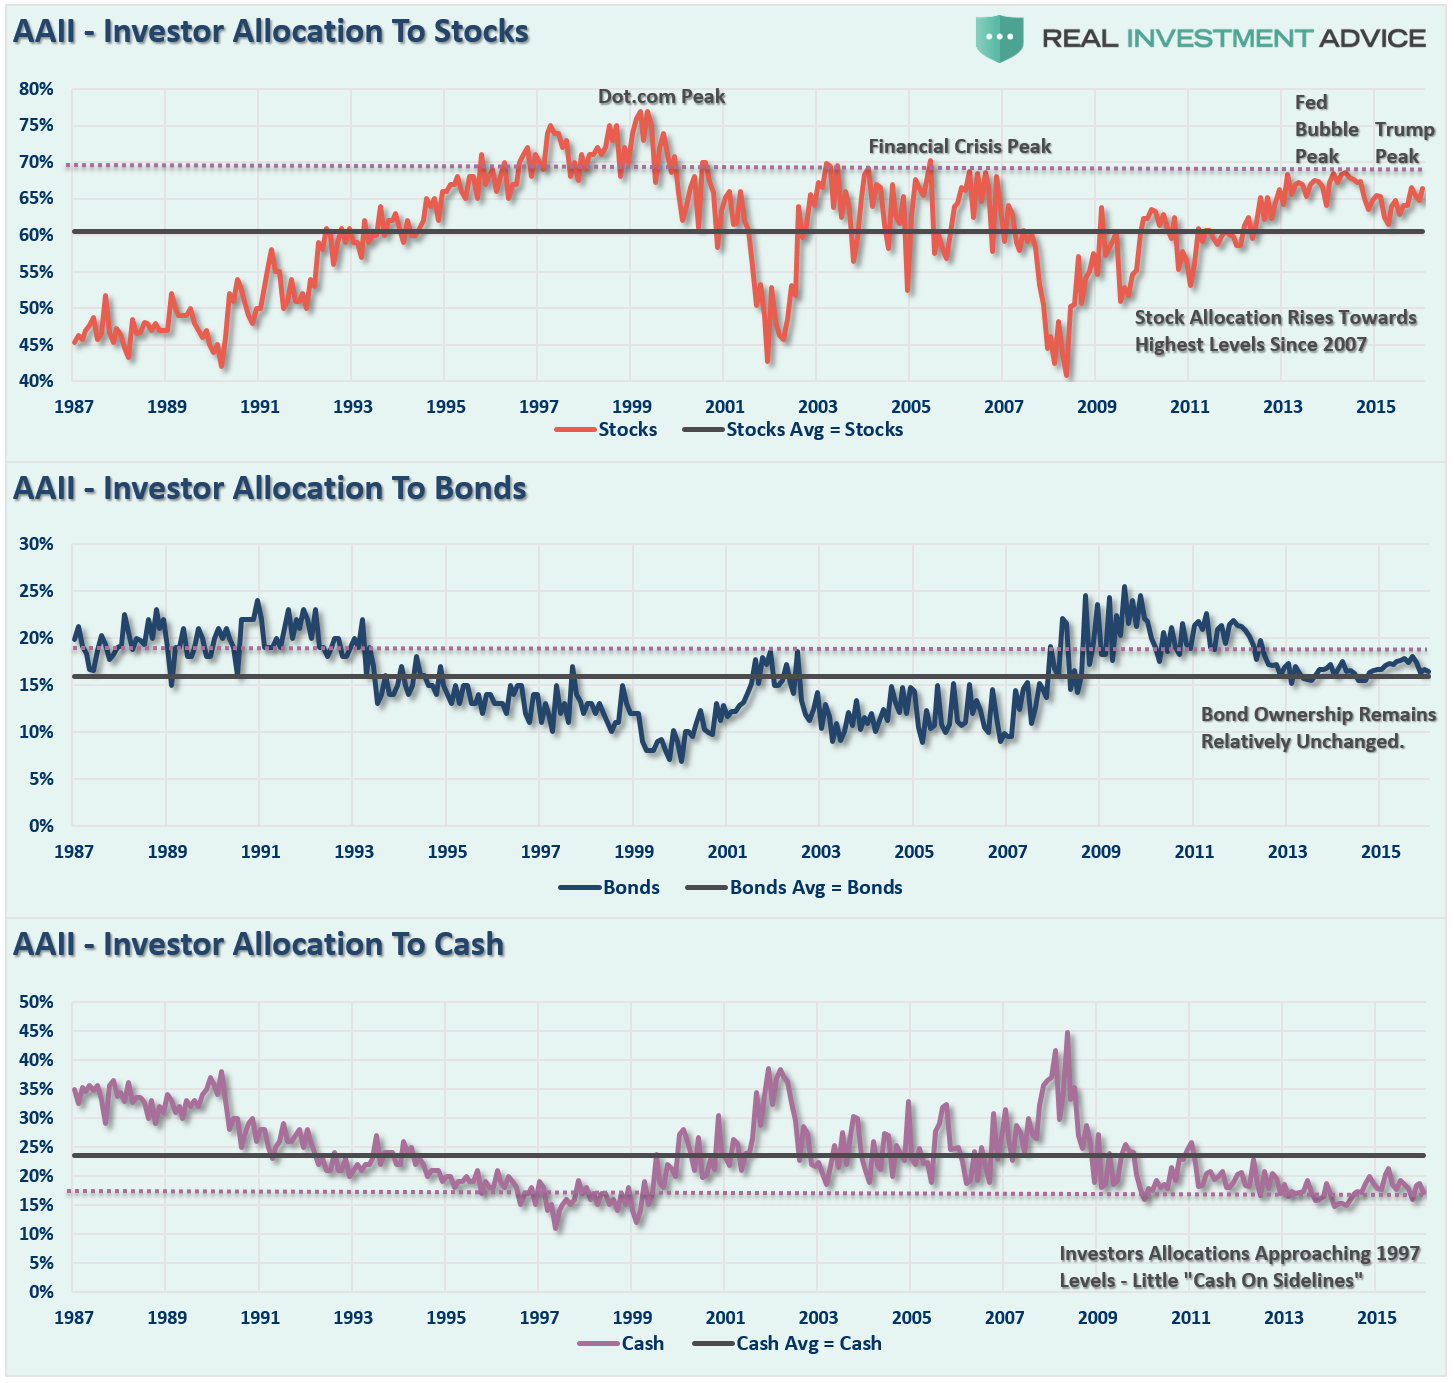
Notice, that despite the recent “rout in bonds,” bond exposure has remained relatively flat is 2012.
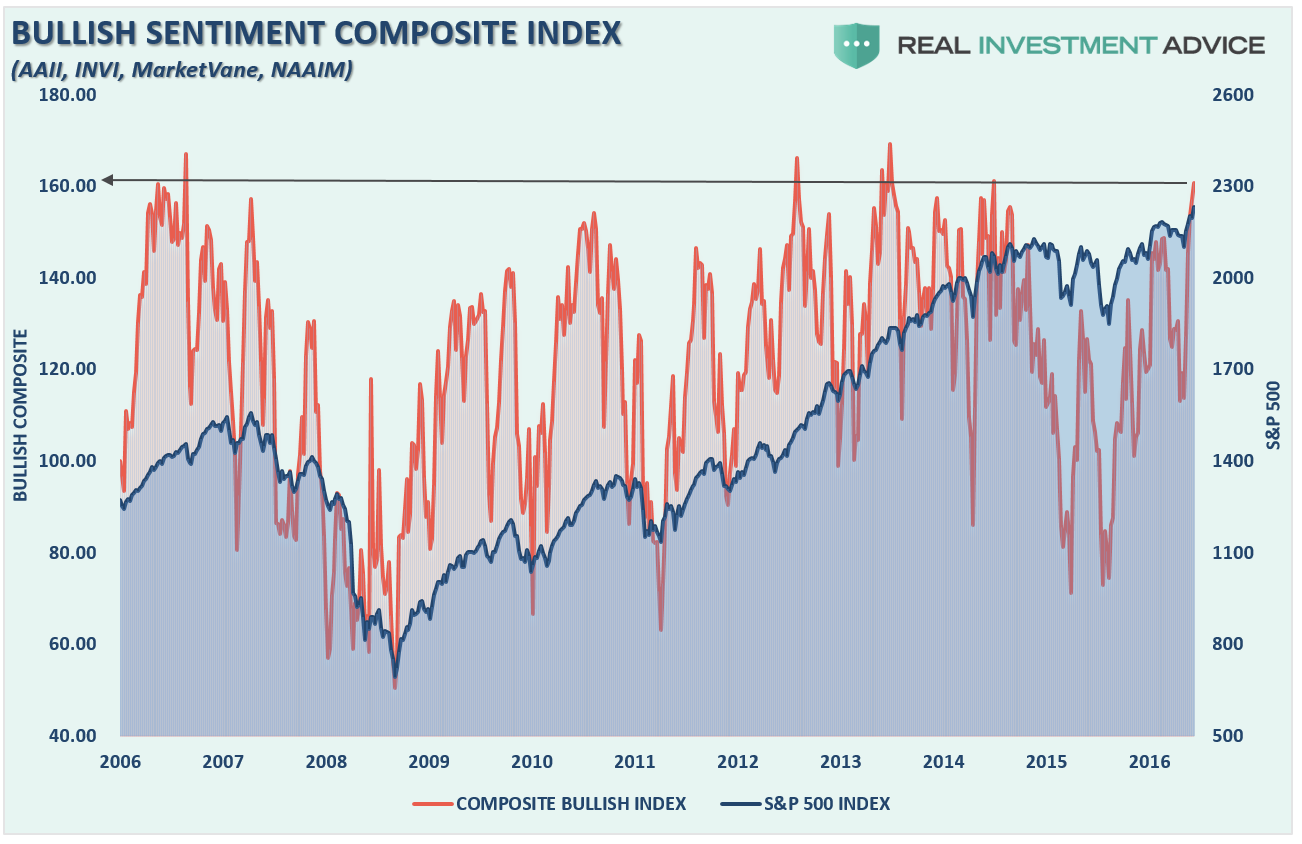
However, it is not just individuals that are “all in,” but the entire spectrum of financial professionals as well. The index below is the composite bullish index of the AAII, INVI, MarketVane and NAAIM investor sentiment indices. I have summed the indices and then recalibrated the index to a starting point of 100.
With bullish sentiment near all-time records, there is little argument that “bullish is back.”
Leverage
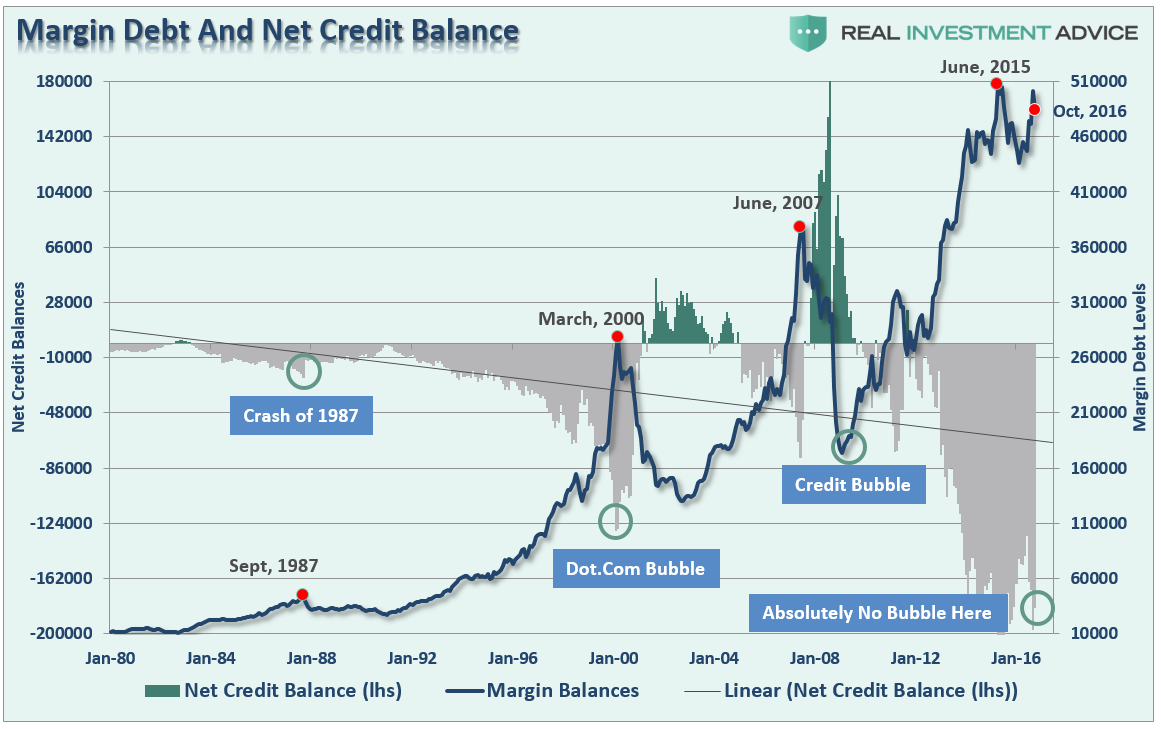
Of course, with both retail and institutional investors fully committed to equity ownership, it is not surprising to see margin debt at record levels also.
There are two important points to make about leverage.
First, there have been several reports suggesting the “record margin debt is NOT a problem.” This is true only during the rise. Margin debt is a huge problem when equities begin to fall.
It is worth noting that when net credit balances have plunged to very negative levels it has been coincident with major mean reverting events in the market.
While ‘this time could certainly be different,’ the reality is that leverage of this magnitude is “gasoline waiting on a match.” When an event eventually occurs, that creates a rush to sell in the markets, the decline in prices will reach a point that triggers an initial round of margin calls. Since margin debt is a function of the value of the underlying “collateral,” the forced sale of assets will reduce the value of the collateral further triggering further margin calls. Those margin calls will trigger more selling forcing more margin calls, so forth and so on.
Secondly, margin debt is still rising as the “fear of missing out” on potential upside in the market is trumping logic. However, this has always been the case with investors as they chase returns, which eventually leads to “buying tops”and “selling bottoms.” This time will very likely turn out similarly.
The chart below has been inverted to make the Net Credit Balances correspond more visually with the rise and fall of the S&P 500 index.
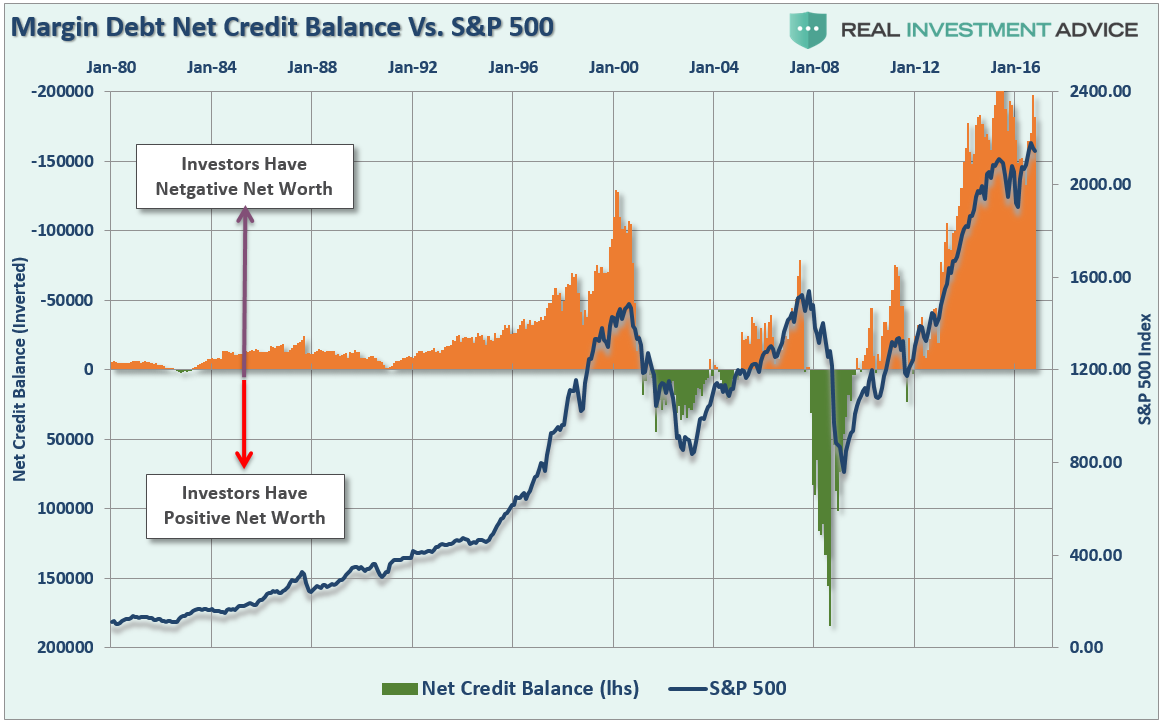
Let me restate the obvious. The important thing to remember about margin debt is that by itself, it is inert and poses no real danger to the market. However, when combined with the correct catalyst, it will act as an accelerant to a market correction when forced liquidations fuel additional selling. You have been warned.
Momentum
I have discussed previously the importance of “price” as an indicator of the market “herd” mentality. One of the major problems with fundamental and macro-economic analysis is the psychology of the “herd” can defy logical analysis for quite some time. As Keynes once stated:
The markets can remain irrational longer than you can remain solvent.
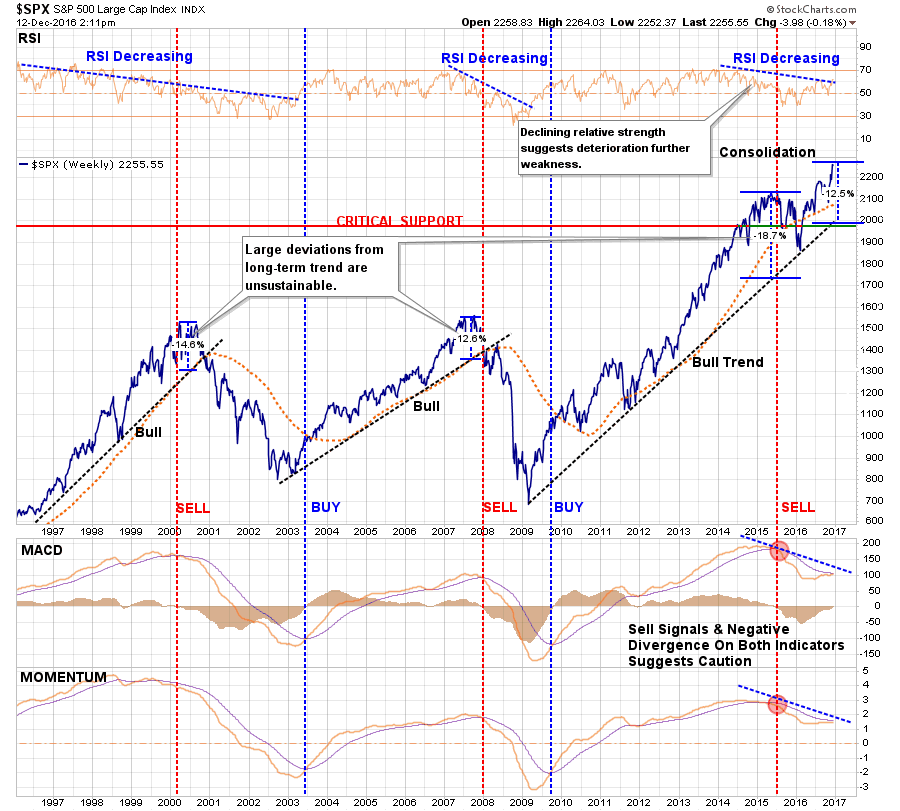
Many an investor have learned that lesson the hard way over time and may be taught again in the not so distant future. As shown in the chart below, the momentum of the market has decidedly changed for the negative. Furthermore, these changes have only occurred near market peaks in the past. Some of these corrections were more minor; some were extremely negative. Given the current negative divergences in the markets from RSI to Momentum, the latter is rising possibility.
Deviations
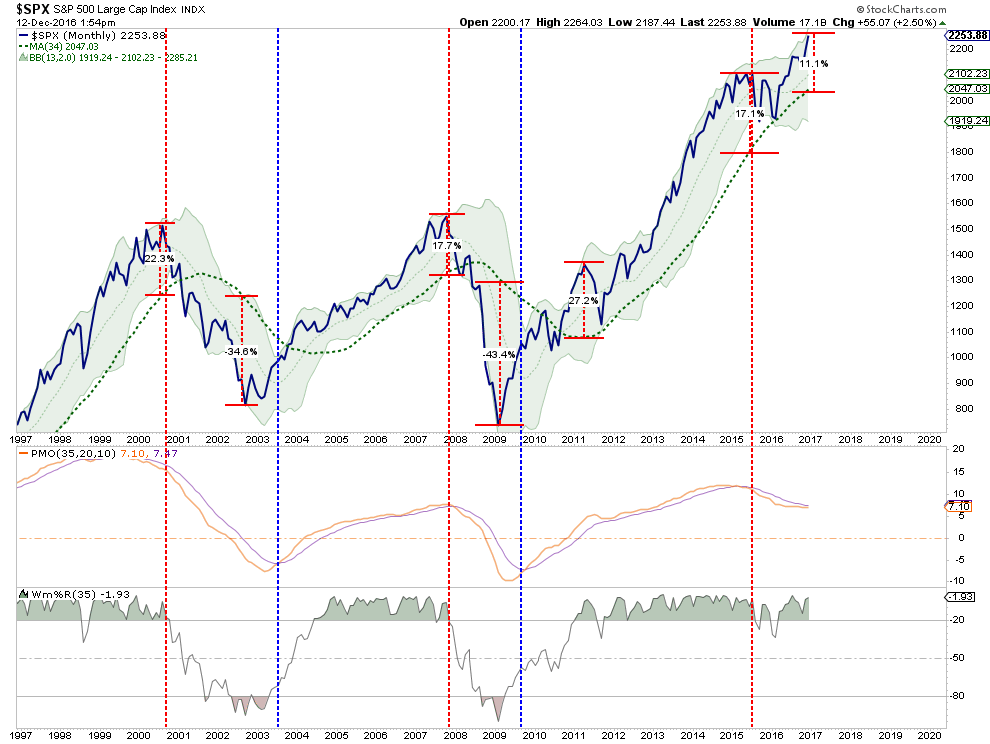
The deviation of the S&P 500 from their respective 34-month moving average is at levels only seen prior to corrections. Importantly, the current deviation is occurring in conjunction with a sell signal which only existed in 2000 and 2007.
The Really Long View Of Cycles
Because a large number of investors today have never witnessed a major bear market, it is easy to dismiss the indicators above as anomalies. Currently, the momentum of the “herd” is a powerful aphrodisiac leading to a litany of reasonings as to why “this time is different.”
As the chart below shows, not only is this time NOT different, it has NEVER been different – ever.
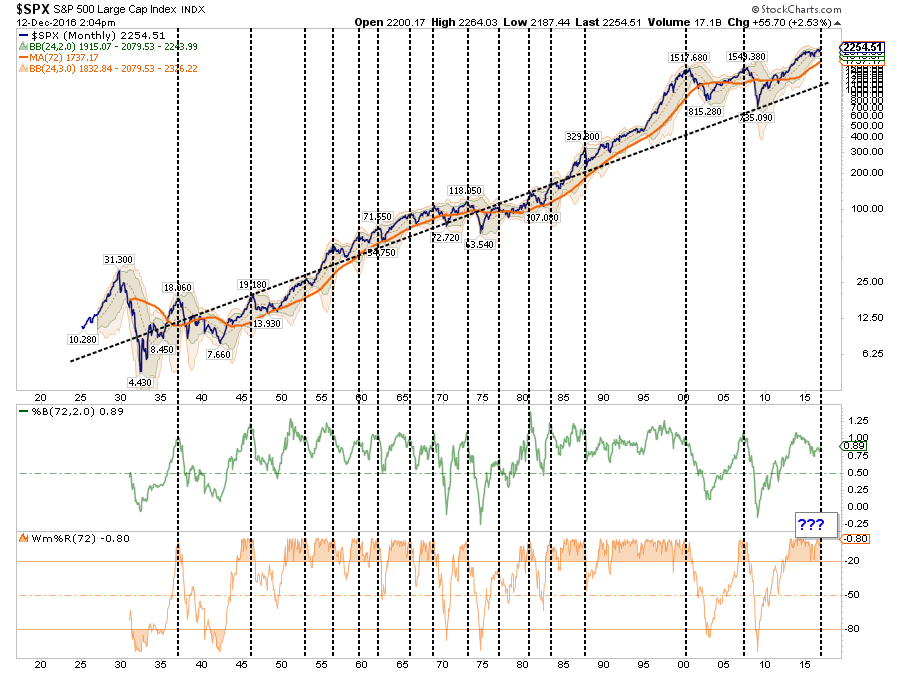
With the markets grossly extended, rates and the dollar rising and monetary policy beginning to tighten, it is only now a function of time until something breaks.
It Is What It Is
I really don’t care much for the bull/bear debate that ensues on a daily basis as both camps are eventually wrong. When investing in the markets “it is, what it is.” It is of very little use some pundit, or analyst, was “right” during the bull market if they never saw the bear market coming. The opposite is also true.
As a money manager, I am currently long the stock market. I must be, or I potentially suffer career risk. However, my job is not only to make money for my clients, but also to preserve their gains, and investment capital, as much as possible. This is why, although I am often considered a “bear”, I focus on the “risks” that prevail.
Understanding, and analyzing, both sets of arguments is crucially important to navigating the markets successfully over time. The REAL RISK to investors is not “missing out” on a further rise in the markets, but catching the bulk of the reversion that will wipe out most of the gains from the previous advance.
Hopefully, these charts will give you some food for thought. Remember, every professional poker player knows how to spot a “pigeon at the table.” Make sure it isn’t you.
