Over the weekend, I discussed the market’s breakout to the upside and the increase in equity exposure in client’s portfolios. As I stated:
“The short-term analysis of the market remains broadly positive with both the ongoing bullish trend and recent break above 2500 remaining intact through the close on Friday.
As shown below, the market is pushing a short-term ‘buy’ signal. However, now at 2-standard deviations above the 75-dma, as seen previously, the market likely has limited upside from here.”
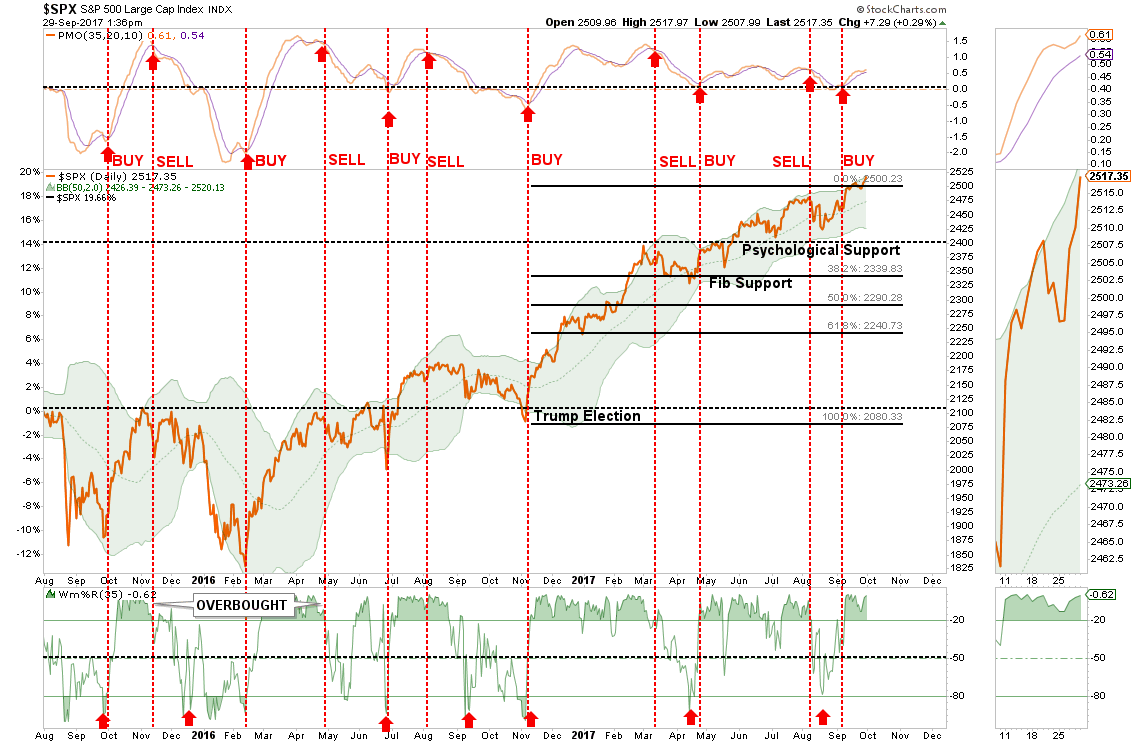
“The breakout, of course, was driven by continued hopes of tax cuts/reforms from the White House as details of the latest proposal from the House Ways and Means Committee were released this week. (Here)
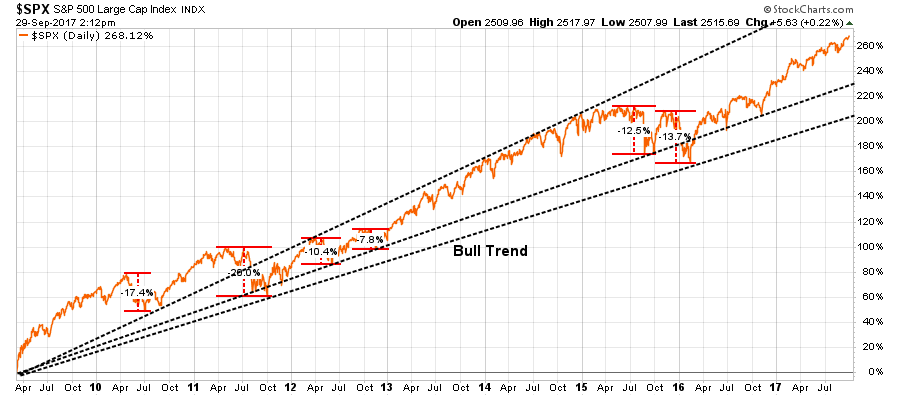
More importantly, since the March 9th, 2009 lows, the bull market has surged more than 268% with no decline greater than 20% along the way. Importantly, the correction in early 2016, did not violate the trend line from the 2011 lows which keeps the current market defined to a singular bull market.”
Buying Because I Have To. You Don’t.
After discussing that we had increased exposure to portfolios last week due to the breakout, and added new money, I received several emails questioning the move. To wit:
“With the markets clearly overvalued, and as you say, excessively extended and bullish, why are you buying? As you have often stated, the risk of loss outweighs potential return.”
That is absolutely correct.
However, there is a difference between views of long-term fundamentally driven potential outcomes and short-term emotionally driven realities.
Importantly, as a portfolio manager, I am buying the breakout because I have to. If I don’t, I suffer career risk, plain and simple.
However, you don’t have to. If you are truly a long-term investor, you have to question the risk being undertaken to achieve further returns in the market.
Think about it this way.
As noted in the chart above, the markets have returned more than 260% since the 2009 lows in the second-longest bull market on record. Yes, it is still just one bull market.
Assuming that you were astute enough to buy the “cherry picked” low, and didn’t spend the bulk of the S&P 500 bull market rally simply getting back to even, you would have accumulated years of excess returns towards meeting your retirement goals.
If you went to cash now, the odds are EXTREMELY high that in the years ahead you will far outpace investors who remain invested. Sure, they may get an edge on you in the short-term, and chastise you for “missing out,” but when the next “mean reverting event” occurs the decline will destroy most, if not all, of the returns accumulated over the last 9-years.
So, if you buy the “breakout,” do so carefully. Keep stop losses in place and be prepared to sell if things go wrong.
For now, things are certainly weighted towards the bullish camp, however, such will not always be the case.
How To Add Exposure
I have also received quite a few emails asking how to add exposure to the market, particularly if in a large cash position currently. The answer is more in line with the age-old question:
“How do you pick up a porcupine? Carefully.”
Here are some guidelines to follow:
- Move slowly. There is no rush in adding equity exposure to your portfolio. Use pullbacks to previous support levels to make adjustments.
- If you are heavily UNDER-weight equities, DO NOT try and fully adjust your portfolio to your target allocation in one move.This could be disastrous if the market reverses sharply in the short term. Again, move slowly.
- Begin by selling laggards and losers. These positions are dragging on performance as the market rises and tend to lead when markets fall. Like “weeds choking a garden,” pull them.
- Add to sectors, or positions, that are performing with, or outperforming, the broader market.
- Move “stop loss” levels up to current breakout levels for each position. Managing a portfolio without “stop loss” levels is like driving with your eyes closed.
- While the technical trends are intact, risk considerably outweighs the reward. If you are not comfortable with potentially having to sell at a LOSS what you just bought, then wait for a larger correction to add exposure more safely. There is no harm in waiting for the “fat pitch” as the current market setup is not one.
- If none of this makes any sense to you – please consider hiring someone to manage your portfolio for you. It will be worth the additional expense over the long term.
The “Rothschild 80/20” Rule
When discussing portfolio management, it is often suggested that you can’t “time the market.”
That statement is correct.
You can not effectively, and repetitively, get “in” and “out” of the market on a timely fashion. I have never suggested that an investor should try and do this. However, I have discussed managing risk by adjusting market exposure at times when “risk” outweighs the potential for further “reward.”
“While I am often tagged as ‘bearish’ due to my analysis of economic and fundamental data for ‘what it is’ rather than ‘what I hope it to be,’ I am actually neither bullish or bearish. I follow a very simple set of rules which are the core of my portfolio management philosophy which focuses on capital preservation and long-term ‘risk-adjusted’ return.”
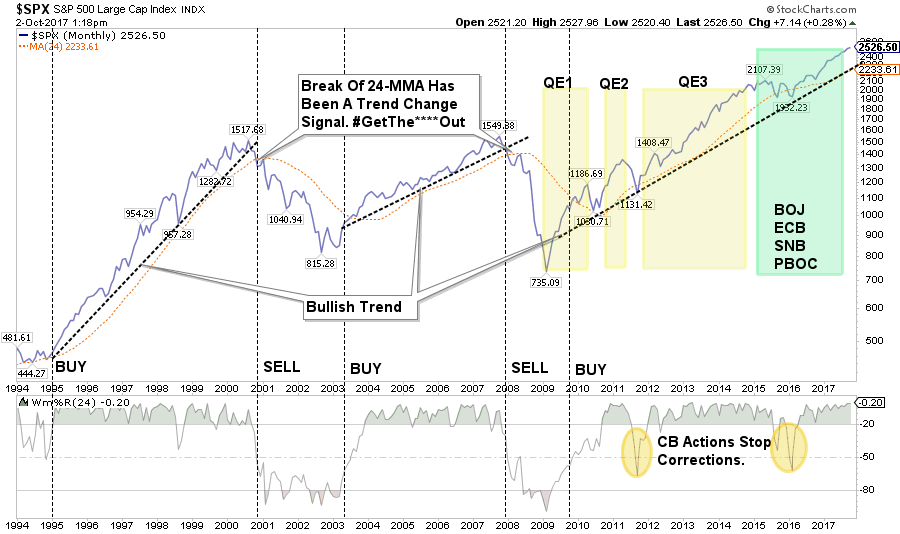
Here is my point. As a long-term investor, I don’t need to worry about short-term rallies. I only need to worry about the direction of the overall market trends and focus on capturing the positive and avoiding the negative.
As Baron Nathan Rothschild once quipped:
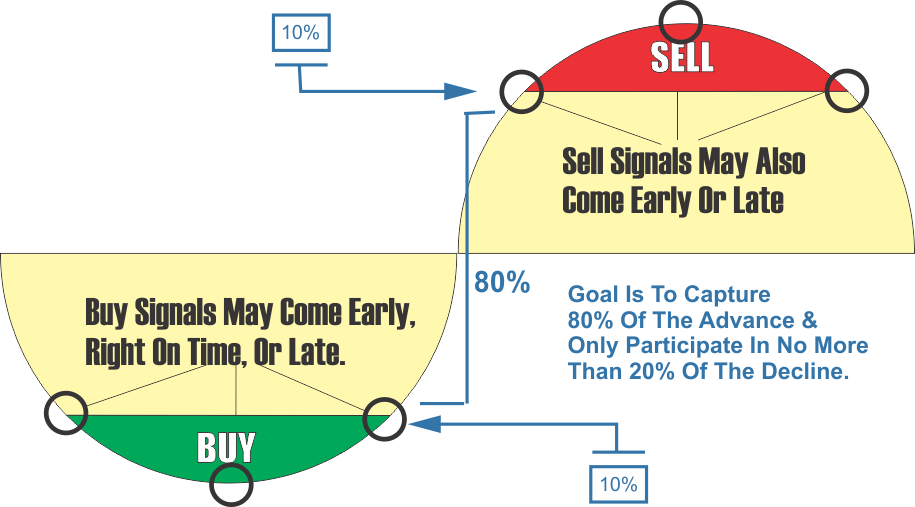
“You can have the top 20% and the bottom 20%, I will take the 80% in the middle.”
This is the basis of the 80/20 investment philosophy and the driver behind the risk management process.
While you may not beat the market from one year to the next, you will never have to suffer the “time loss” required to “get back to even.” In the long run, you will win.
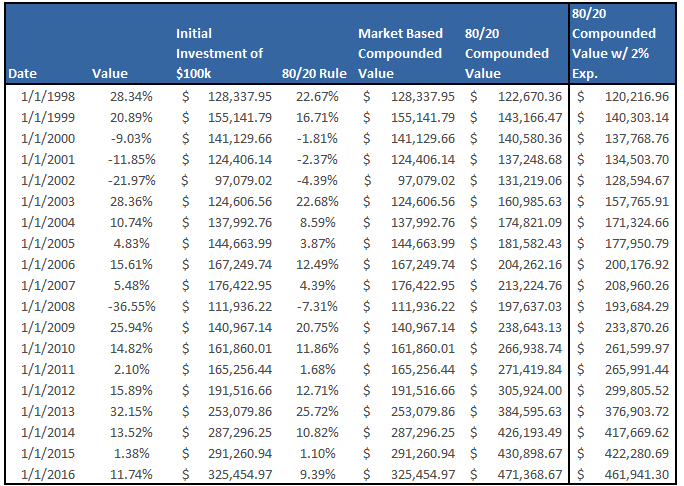
As shown in the table below, a $100,000 investment in the S&P 500 returns a far lower value than the “Rothschild 80/20 Rule” model. This is even if I include a ridiculous 2% management fee.
Here is a chart to illustrate the deviation more effectively. (Capital appreciation only.)
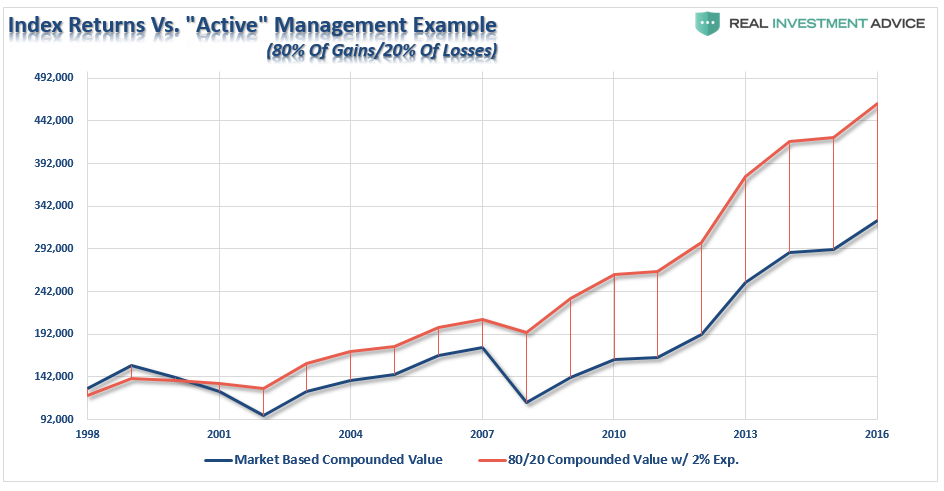
Yes, it’s only a bit more than a hundred thousand dollars worth of difference, but the reduced levels of volatility allowed investors to emotionally “stick” to their discipline over time. Furthermore, by minimizing the drawdowns, assets are allowed to truly “compound” over the long-term.
An easy way to apply this principle is to use a simple moving average crossover. In the chart below, you are long equities which the S&P 500 index is above the 12-month moving average, and you switch to bonds when the S&P 500 falls below the 12-month average.
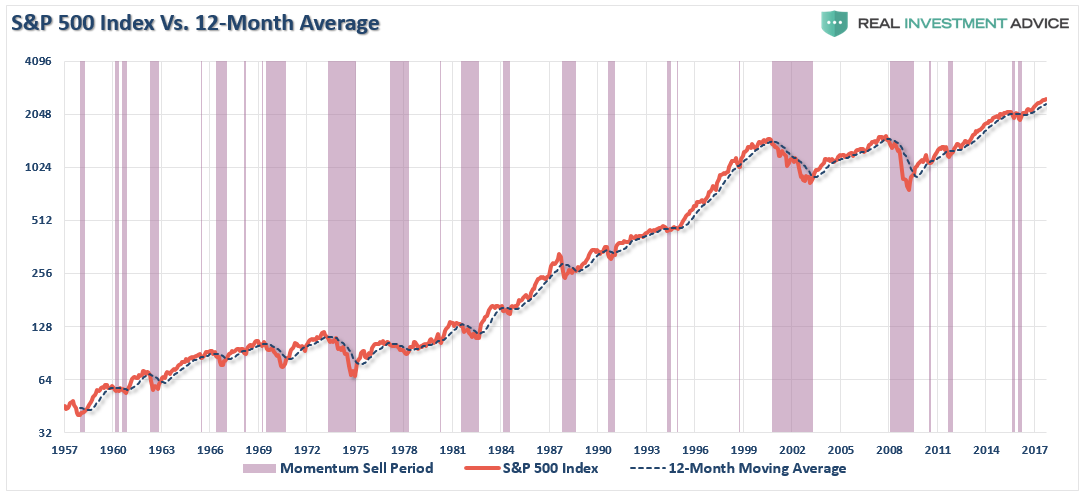
No, it’s not perfect every time. But no measure of risk management is.
But having a discipline to manage risk is better than not having one at all.
Get it. Got it. Good.
Cracks In The Bull Market Armor
While we did increase exposure to the market in portfolio last week, as the bullish trend does currently persist, there is growing evidence of “cracks” appearing.
With the Fed now on track to begin reducing support for the market, and a real possibility that “tax reform” will fail to materialize anytime soon, the possibility of a trap getting sprung on unwitting investors is rising.
The current rally is built on a substantially weaker fundamental and economic backdrop. Therefore, it is extremely important to remember that whatever increase in equity risk you take, could very well be reversed in short order due to the following reasons:
- We are moving into the latter stages of the bull market.
- Economic data continues to remain weak
- Earnings are beating continually reduced estimates
- Volume is weak
- Longer-term technical underpinnings are weakening and extremely stretched.
- Complacency is extremely high
- Share buybacks are slowing
- The yield curve is flattening
It is worth remembering that markets have a very nasty habit of sucking individuals into them when prices become detached from fundamentals. Such is the case currently and has generally not had a positive outcome.
What you decide to do with this information is entirely up to you. As I stated, I do think there is enough of a bullish case being built to warrant taking some equity risk on a very short-term basis. We will see what happens over the next couple of weeks.
However, the longer-term dynamics are turning more bearish. When those negative price dynamics are combined with the fundamental and economic backdrop, the “risk” of having excessive exposure to the markets greatly outweighs the potential “reward. “
While it is certainly advisable to be more “bullish” currently, like picking up a “porcupine,” do so carefully.
Investing is not a competition.
It is a game of long-term survival.
