Leaders of the United States and China have agreed to resume trade negotiations
At the G20 meeting last weekend, Chinese Chairman Xi Jinping and US president Donald Trump agreed to resume trade negotiations between the countries. Will the Cotton quotations increase?
The U.S. president expressed the hope that China will acquire more agricultural products from the United States. China acquires about a quarter of global cotton imports and is the largest importer. The United States ranks 1st in the world in the export of cotton with a share of about 38%. After the announcement of the successful conclusion of negotiations between the leaders of the United States and China, the cotton quotations soared by 3% and updated a maximum of a month. An additional positive factor could be a reduction in the forecast for cotton crop area in the US in the agricultural season 2019/20 from U.S. Department of Agriculture (USDA). In the June forecast of the US Department of Agriculture, an area of 13.72 million acres is indicated, which is less than its March estimate of 13.78 million acres. The India Meteorological Department reported that June this year turned out to be the driest in the last 5 years and the amount of precipitation decreased by about a third compared with the average level. Drought can reduce cotton production in India.

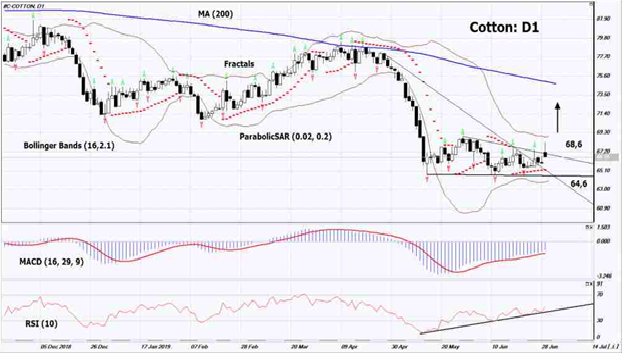
On the daily timeframe Cotton: D1 is trying to exit the downtrend and from the triangle to the top. Various technical analysis indicators have generated uptrend signals. Further growth of quotations is possible in case of an increase in global demand and deterioration of the weather in India.
- The Parabolic indicator shows a signal to increase.
- The Bolinger bands narrowed, indicating a volatility decrease. Both lines of Bollinger have a slope up.
- The RSI indicator is above the 50 mark. It has formed a divergence to the increase.
- The MACD indicator shows a signal to increase.
The bullish momentum may develop if the Cotton exceeds its last maximum: 68.6. This level can be used as an entry point. The initial stop lose may be placed below the last three lower fractals, the Parabolic signal and a 3-year low: 64.6. After placing the pending order, the stop loss shall be moved following the signals of Bollinger and Parabolic to the next fractal minimum.Thus, we are changing the potential profit/loss to the breakeven point. More risk-averse traders may switch to the 4-hour chart after the trade and place a stop loss moving it in the direction of the trade. If the price meets the stop level (64,6)) without reaching the order (68,6), we recommend to cancel the order: the market sustains internal changes that were not taken into account.
Technical Analysis Summary
| Position | Buy |
| Buy stop | Above 68,6 |
| Stop loss | Below 64,6 |
Market Overview
SP 500 closes at new record
Dollar strengthened lifted by manufacturing data
US stock market closed at new record on Monday led by technology stocks after president Trump agreed with his Chinese counterpart to resume trade talks as they hold off on imposing additional tariffs. The S&P 500 rose 0.8% to 2964. Dow Jones industrial added 0.4% to 26717. The Nasdaq composite surged 1.1% to 8091. The dollar weakening reversed as both the Markit’s purchasing managers index and Institute for Supply Management’s manufacturing indexes showed US manufacturing sector continued expanding in June. The live dollar index data show the ICE (NYSE:ICE) US Dollar index, a measure of the dollar’s strength against a basket of six rival currencies, jumped 0.7% to 96.81 but is lower currently. Futures on US stock indices point to higher openings today.
European indexes advance despite weak manufacturing data
European stocks accelerated gains on Monday after US and China agreed on trade truce Saturday. Both GBP/USD and EUR/USD turned lower but are higher currently. The Stoxx Europe 600 index rose 0.9% led by chip maker shares despite weak euro zone PMI data. The DAX 30 advanced 1% to 12521.38 despite a report German manufacturing sector activity slowed in June for the sixth month in a row. France’s CAC 40 added 0.5% and UK’s FTSE 100 gained 1% to 7497.5 while UK’s June manufacturing PMI reading fell to its lowest since October 2012.
Hang Seng leads Asian indexes gains
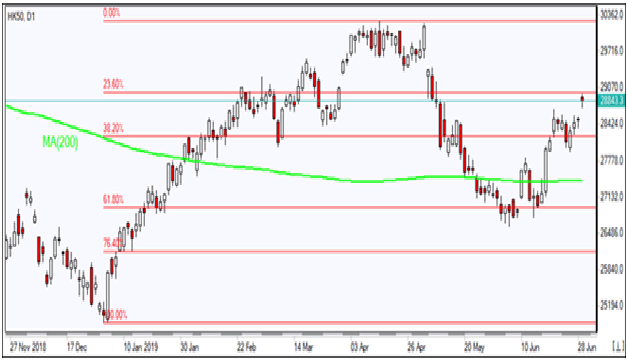
Asian stock indices are mostly rising today after president Trump said Monday that renewed talks have “already begun”. Nikkei closed 0.1% higher at 21754.27 with yen little changed against the dollar. Markets in China are mixed: the Shanghai Composite Index is down 0.03% while Hong Kong’s Hang Seng Index is 1.4% higher. Australia’s All Ordinaries Index extended gain 0.1% as Australian dollar resumed climbing against the greenback despite a 25 basis points cut in interest rates to 1% by the Reserve Bank of Australia.

Brent gaining ahead of OPEC meeting
Brent futures prices are extending gains today ahead of OPEC official meeting with non-OPEC producers. Prices rose yesterday after OPEC said it officially agreed to extend production curbs by nine months: September Brent crude rose 0.5% to $65.06 a barrel on Monday.
