I listen to sports talk radio in the morning for entertainment. Today, a popular broadcaster went off script to chat about the ridiculous nature of political correctness, surmising that Americans obsess over social issues when they have few concerns about the economy. He went so far as to describe the economic environment as exceptional, after which, I promptly spilled coffee into my lap.
Exceptional? I wondered if perhaps he had confused his brokerage account balance – a paper net worth that was likely sitting near all-time records – with the country’s economic health. Had he not heard of the most common method for assessing a country’s well-being? The annual accounting of the monetary value on all finished goods and services has a name, gross domestic product (GDP). What’s more, annual GDP growth since 2009 has been remarkably slow at 2.2%, representing the slowest post-recession growth in history.
“Well, Gary,” you say. “Growth is still growth, is it not?” Not exactly. The anemic pace of growth has occurred with the the use of trillions upon trillions of debt – $7.5 trillion in excess federal government outlays and $3.75 trillion in U.S. Federal Reserve bond-buying stimulus. The debt-driven expansion has primarily benefited the wealthiest among us, myself included. Yet it has failed to help families whose livelihoods depend entirely on household income, as opposed to rising stock and real estate assets.
How might one describe the U.S. economy, then? We know that inflation-adjusted household incomes are lower than they were before the Great Recession – about 3% lower. We also know that the number of houses being sold is 1/3 lower than the number being sold 10 years ago. Yet the stock market is nearly 35% higher than it was at the height of 2007 and home prices have skyrocketed approximately 35% over the last three years. Once again, stock and property values are rising, yet wages are stagnating.
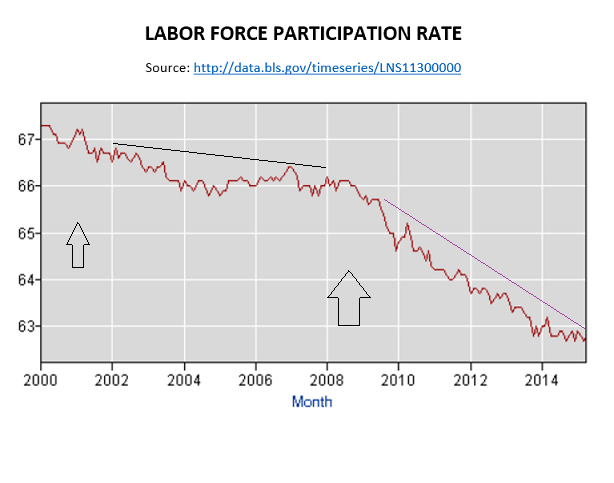
Even the idea that the job market has healed with a headline unemployment data point of 5.4% is severely flawed. The percentage of working-aged Americans in the labor force at 62.8% (a.k.a. the employment rate) is at the lowest percentage since the late 1970s. Does anyone believe that the Fed would keep interest rates near 0% for six-and-a-half years if 5.4% unemployment meant that 94.6% of those who wanted to work were doing so? At full-time jobs with wages anywhere close to what folks had been earning prior to the Great Recession?

So how is it that I might present a variety of facts about economic fragility, and you’ll still find scores of folks like the sports broadcaster who express glee about the economy? It is called the wealth effect – the phenomenon where huge gains in stocks and real estate make people more secure about their wealth. The Federal Reserve engineered a wealth effect in the hopes that the financial security experienced by the top earners would lead them to consume in large quantities; similarly, the Fed had hoped that the extended period of low rates would lead companies to feel more secure about borrowing, spending and ultimately, hiring.
Unfortunately, the engineered wealth effect by the Fed did not exactly trickle down to the majority of the population. Corporations spent trillions of borrowed bucks at low rates on buying back shares of their own stock, boosting the share prices of those stocks. The wealth effect worked for the wealthiest. Did it work for workers in their pursuit of quality jobs? Hmmm, not so much.
Perhaps the big question for the investor might be, “If stocks are benefiting me today, good economy or bad, why should I care?” Although the economy is not the market, and the market is not the economy, there’s no denying that fear of recession often drags stocks into the commode. And fears of recession may escalate if the Federal Reserve makes good on its intention to raise borrowing costs for the first time in close to a decade.
Keep in mind, the Fed acted to raise its target lending rate on only two other occasions when the U.S. economy had been growing at a sub-par clip (1948, 1980). In less than a year’s time, in both instances, a new recession emerged.
That is why it is crucial to pay attention to what stocks and bonds are saying about the potential for recessionary pressures to get out hand. For instance, in spite of the media focus on famous benchmarks like the Dow 30, the NASDAQ 100 and the S&P 500, the New York Stock Exchange still remains the world’s largest stock exchange by both trade value and market capitalization. It follows that tracking the NYSE Composite is crucial for understanding broader U.S. market implications.
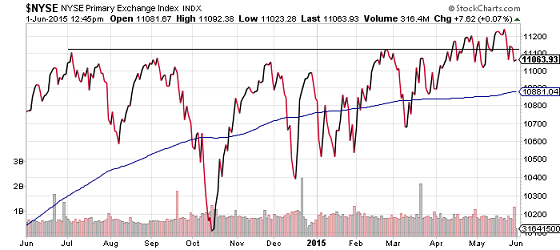
The NYSE Composite measures the performance of all stocks listed on the exchange. For nearly a year now, movement on the index has been down, up, and ultimately, sideways.

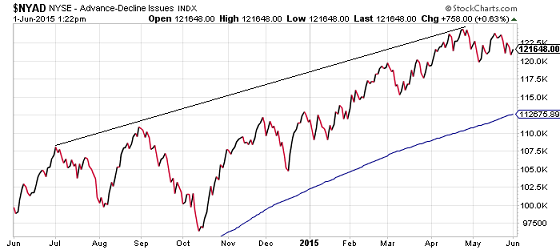
Based on what one can see about the NYSE Composite, one might describe the investing environment as “choppy.” Yet choppiness is hardly a sure-fire sign of imminent deterioration. In fact, this very same index has a more prevalent tool for identifying trends called the Advance-Decline (A/D) Line. In the chart below, one can see the relatively healthy A/D Line sloping upwards from one year ago through late April of this year.

Since late April, however, the number of declining stocks have started to put pressure on the number of advancing stocks. The possible weakening of market internals can be problematic. In fact, other than the September-October pullback in 2014, there hasn’t been a genuine threat to the broader market’s bullish upswing since the euro-zone debt disaster in the summer of 2011.
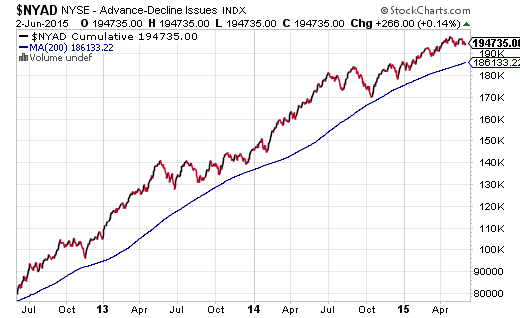
Technically speaking, the stock market uptrend remains intact. Yet you should not fall victim to a siren’s song called, “Where Else Are You Gonna Go?” There will come a time when 0% interest in a cash account or a 2.25% annual yield on a 10-year Treasury bond will be far more preferable than overvalued equities. Keep an eye on the A/D line, and be mindful of a breach below the 200-day moving average.

Disclosure: Gary Gordon, MS, CFP is the president of Pacific Park Financial, Inc., a Registered Investment Adviser with the SEC. Gary Gordon, Pacific Park Financial, Inc, and/or its clients may hold positions in the ETFs, mutual funds, and/or any investment asset mentioned above. The commentary does not constitute individualized investment advice. The opinions offered herein are not personalized recommendations to buy, sell or hold securities. At times, issuers of exchange-traded products compensate Pacific Park Financial, Inc. or its subsidiaries for advertising at the ETF Expert web site. ETF Expert content is created independently of any advertising relationships.
