
Our intraday outlook is now bearish, and our short-term outlook is bearish. Our medium-term outlook remains neutral, following S&P 500 index breakout above last year's all-time high:
Intraday outlook (next 24 hours): bearish
Short-term outlook (next 1-2 weeks): bearish
Medium-term outlook (next 1-3 months): neutral
Long-term outlook (next year): neutral
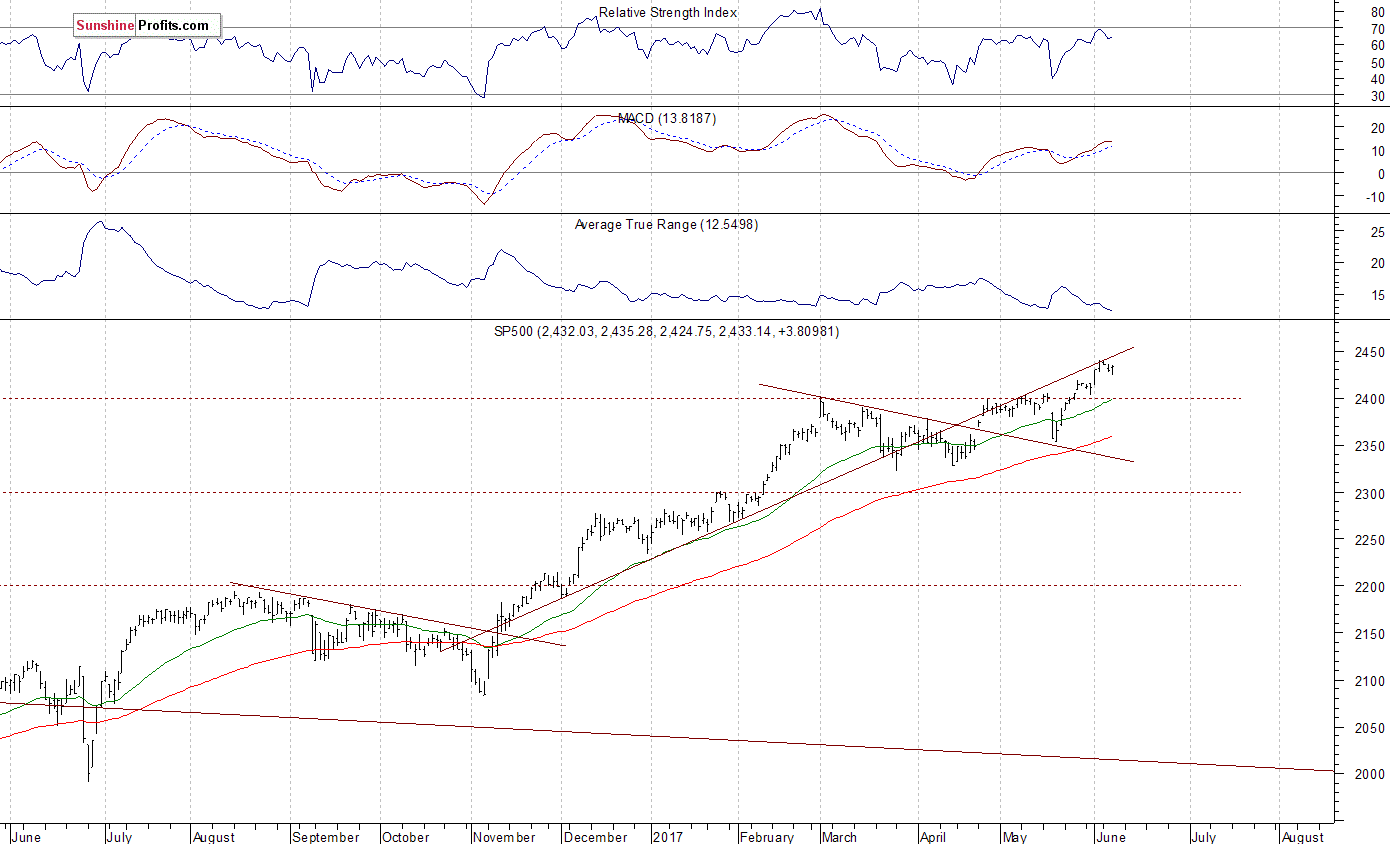
The main U.S. stock market indexes gained 0.2-0.4% on Wednesday, extending their short-term consolidation, as investors continued to hesitate following recent rally. The S&P 500 index trades just 0.3-0.4% below its last Friday's new all-time high of 2,440.23. It has broken above week-long consolidation along 2,400 mark recently. Stocks have rebounded strongly after their mid-May quick two-session sell-off. They continue their over eight-year-long bull market off 2009 lows. The Dow Jones Industrial Average remained below the level of 21,200 on Wednesday, following last Friday's advance to new record high of 21,225.04. The technology Nasdaq Composite remains relatively stronger than the broad stock market, as it continues to trade along the record level of 6,310.6. The nearest important resistance level of the S&P 500 index is at around 2,440-2,450, marked by new record high, among others. On the other hand, support level is currently at around 2,415-2,420, marked by previous resistance level. The next support level is at 2,400-2,410, marked by the May 25 daily gap up of 2,405.58-2,408.01, among others. The support level is also at 2,390-2,395, marked by some short-term local lows. Will the uptrend continue towards 2,500 mark? There have been no confirmed negative signals so far. However, we can see some overbought conditions and negative technical divergences. The S&P 500 index is currently trading close to its November-April upward trend line, as we can see on the daily chart:
Positive Expectations Following Yesterday's Rebound
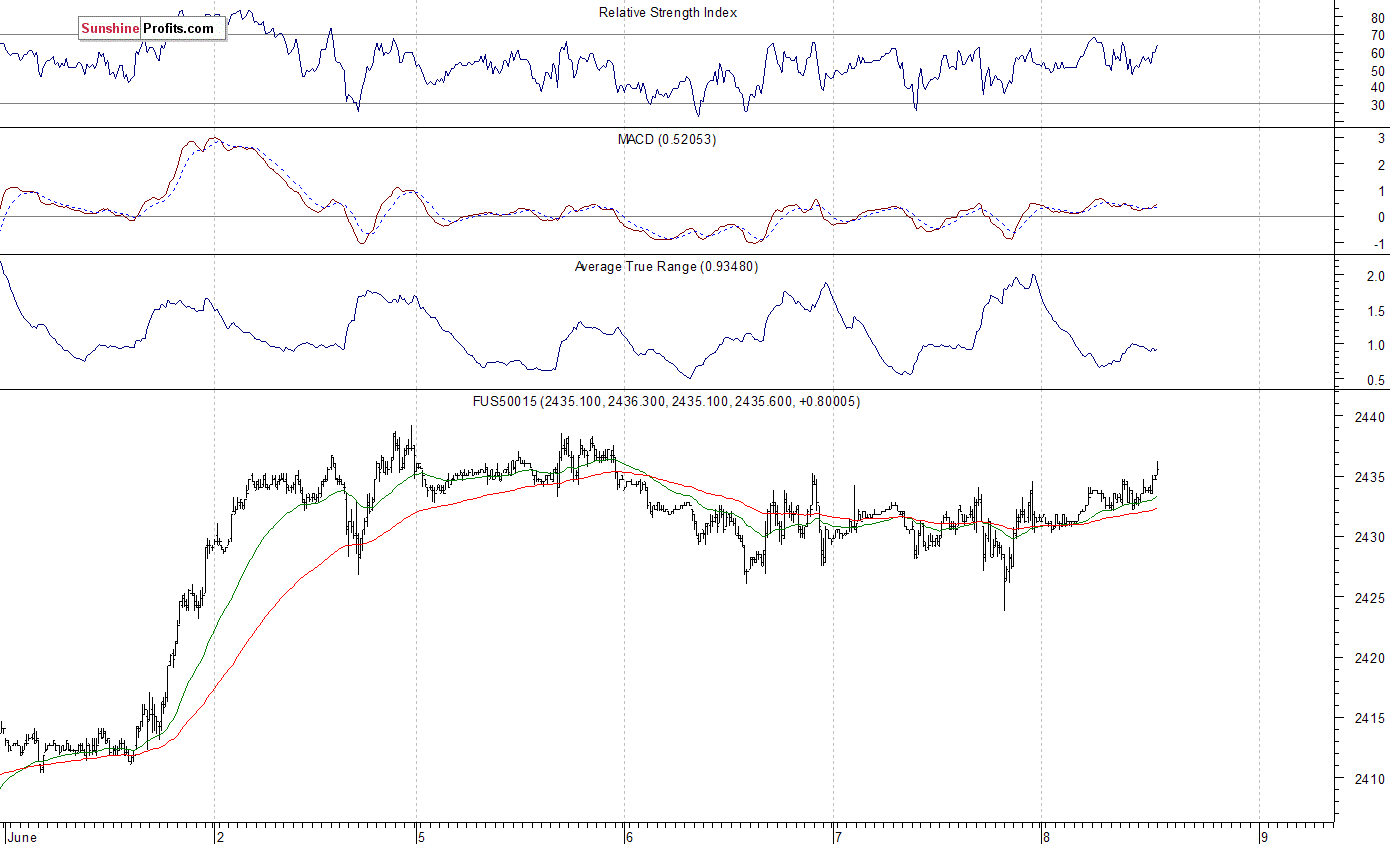
Expectations before the opening of today's trading session are positive, with index futures currently up 0.2% vs. their Friday's closing prices. The European stock market indexes have been mixed so far. Investors will now wait for the Initial Claims number release at 8:30 a.m. The market expects that it was at 240,000 last week. The S&P 500 futures contract trades within an intraday consolidation, following an overnight move up. It continues to trade relatively close to Friday's new record high along the level of 2,440. The nearest important resistance level is at around 2,435-2,440. On the other hand, support level is at 2,425-2,430, marked by recent local lows. The next support level remains at 2,400-2,410. The market trades within a short-term uptrend, as it is above the early March local high. There have been no confirmed negative signals so far. However, we can see some short-term overbought conditions, along with negative technical divergences:
Technology Stocks Remain Relatively Very Strong
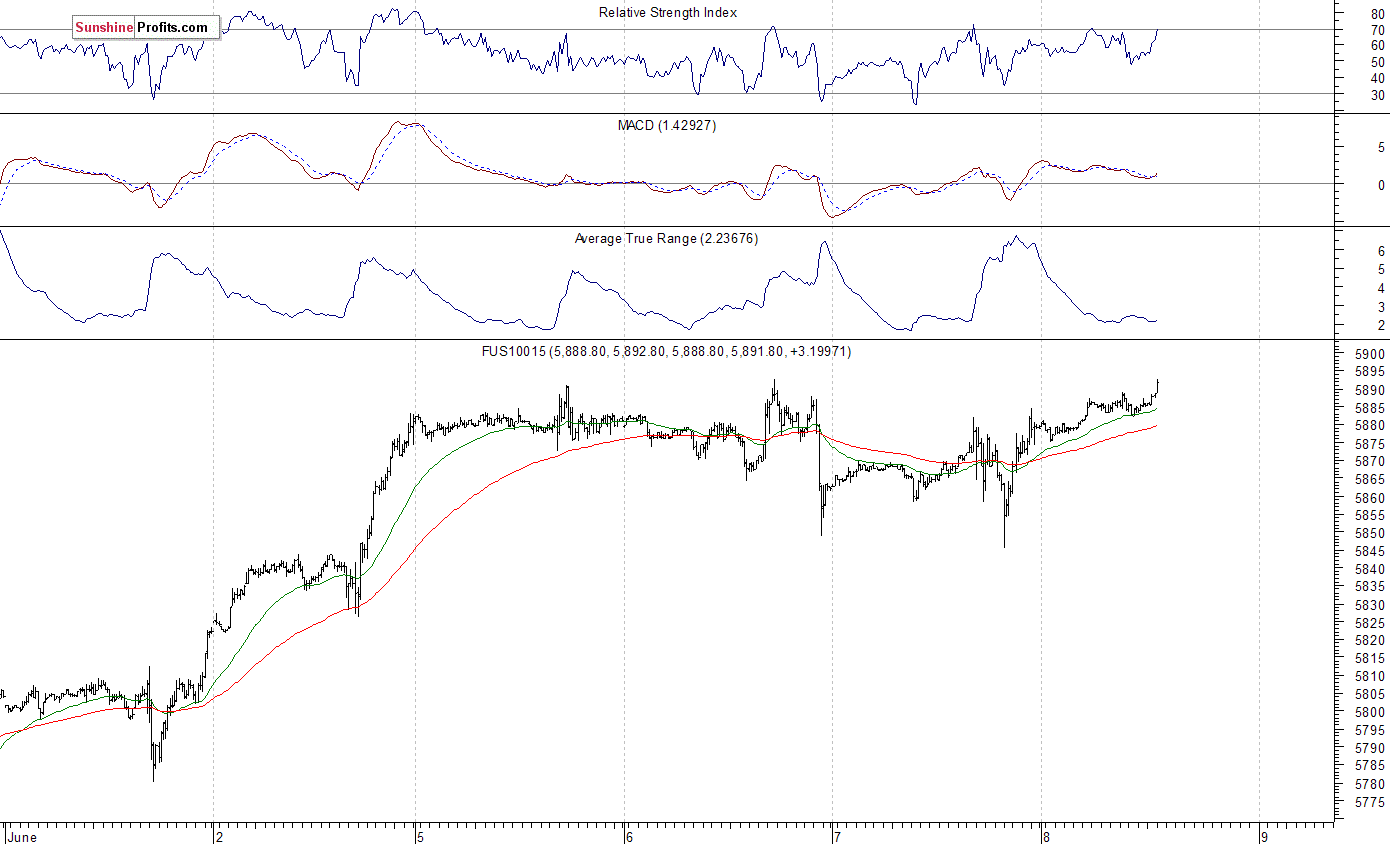
The technology Nasdaq 100 futures contract follows a similar path, as it currently trades within an intraday consolidation along the level of its all-time high. The market extended its six-week-long rally following late April breakout above the level of 5,500. The nearest important level of resistance is at around 5,890-5,900. Potential level of resistance is also at 6,000 mark. On the other hand, the nearest important level of support is at around 5,830-5,850, marked by recent fluctuations. The next support level is at 5,800-5,820, marked by short-term consolidation. There have been no confirmed negative signals so far. But will technology stocks continue their rally despite some short-term overbought conditions? We can see some negative technical divergences:
Concluding, the S&P 500 index continued to trade within a short-term consolidation on Wednesday, as investors remained uncertain following recent rally. The broad stock market extended its gains after a breakout above early March high along the level of 2,400. But will the uptrend continue despite some negative technical divergences along with overbought conditions? Is this some topping pattern before downward reversal or just another flat correction within an uptrend? There have been no confirmed negative signals so far.