
Our intraday outlook is bearish, and our short-term outlook is bearish. Our medium-term outlook remains neutral, following S&P 500 index breakout above last year's all-time high:
Intraday outlook (next 24 hours): bearish
Short-term outlook (next 1-2 weeks): bearish
Medium-term outlook (next 1-3 months): neutral
Long-term outlook (next year): neutral
The U.S. stock market indexes gained between 0.7% and 1.4% on Wednesday, retracing their Tuesday's move down, as investors reacted to economic data announcements, among others. The S&P 500 index bounced off Tuesday's local low at around 2,420. The broad stock market index is now trading around 0.5% below its last week's new all-time high of 2,453.82. It has reached new record high after a breakout above short-term consolidation along the level of 2,420-2,440. Stocks have rebounded sharply following their mid-May quick two-session sell-off and continued over eight-year-long bull market off 2009 lows. The Dow Jones Industrial Average was relatively weaker yesterday, as it gained 0.7%. It is trading closer to the level of 21,500. The technology Nasdaq Composite was relatively stronger than the broad stock market yesterday, as it gained 1.4% following big tech stocks rebound. The nearest important support level of the S&P 500 index is at around 2,425-2,430, marked by yesterday's daily low. The next level of support remains at 2,415-2,420, marked by some recent local lows. The support level is also at 2,400-2,410, marked by the May 25 daily gap up of 2,405.58-2,408.01, among others. On the other hand, level of resistance is at 2,450-2,455, marked by all-time high. There have been no confirmed negative signals so far. However, we can see overbought conditions and negative technical divergences. The S&P 500 index is trading within its three-week-long consolidation, as we can see on the daily chart:

Will Uptrend Continue?
Expectations before the opening of today's trading session are virtually flat, with index futures currently between -0.2% and +0.1% vs. yesterday's closing prices. The European stock market indexes have been mixed so far. Investors will now wait for some economic data announcements: Initial Claims, GDP - Third Estimate at 8:30 a.m. The market expects that the U.S. Gross Domestic Product grew 1.2% in Q1. The S&P 500 futures contract trades within an intraday downtrend, as it retraces some of yesterday's move up. The nearest important level of resistance is at around 2,440-2,445, marked by local highs. On the other hand, support level is at 2,425-2,430, marked by some recent fluctuations, and the next support level is at 2,400-2,420. Is this a new short-term uptrend or just another move up within few-week-long consolidation?

Tech Stocks Rally
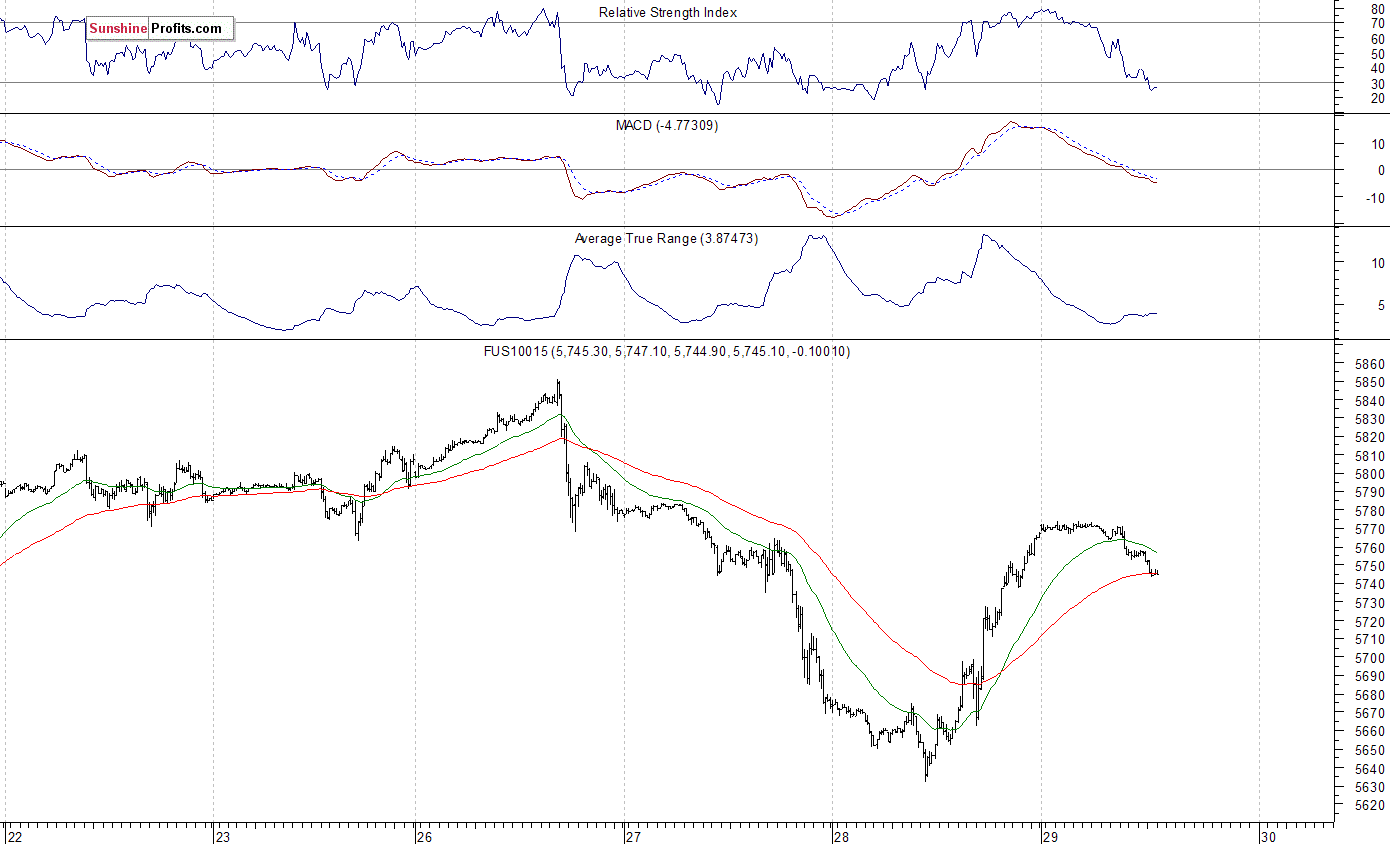
The technology Nasdaq 100 futures contract follows a similar path, as it trades within an intraday downtrend. The market retraces some of its Wednesday' rally. Is this just an upward correction? The nearest important level of resistance is at around 5,770-5,780, marked by local high. The next resistance level is at 5,800. On the other hand, support level remains at 5,700, among others, as the 15-minute chart shows:
Concluding, the S&P 500 index bounced off its Tuesday's low yesterday. The broad stock market has retraced its recent sell-off. But will it continue higher? The index is trading just 0.5% below last week's record high. There have been no confirmed negative signals so far. However, we still can see negative technical divergences, along with medium-term overbought conditions.