Not too long ago, we noted the Dow Jones Industrial Average's (DJI) golden cross -- when its 50-day moving average moved back above its 200-day moving average, often seen as a bullish technical indicator. Since then, its fellow stock market indexes, the S&P 500 Index (SPX) and Nasdaq Composite (IXIC), have made golden crosses of their own. It's the first time all three benchmarks have made golden crosses within a 30-day span since May 2016. Here's what that could mean for the Dow, SPX, and Nasdaq for the rest of 2019 and beyond, if history is any indicator.
Unlike the Dow, after a lone golden cross, the S&P has averaged healthier-than-usual returns looking one, three, six, and 12 months out, per data from Schaeffer's Senior Quantitative Analyst Rocky White. For instance, the index has averaged a three-month gain of 4.07% after a golden cross, and was higher more than three-quarters of the time. That's compared to an average anytime three-month return of 2.12% since 1950, with a positive rate of just 65.9%.
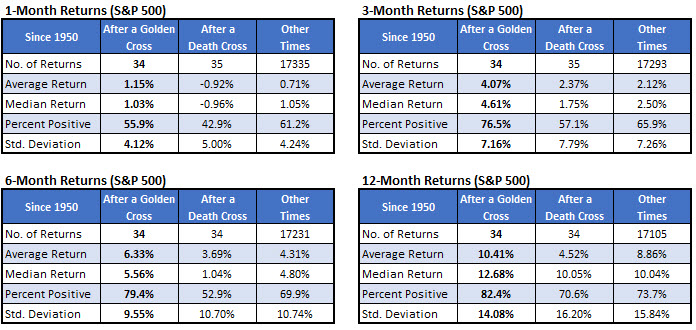
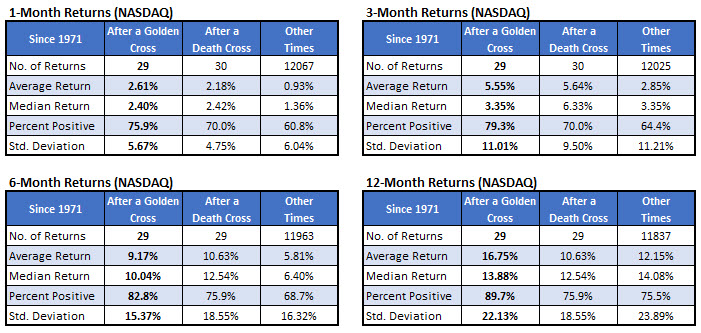
It's a similar situation with the Nasdaq. Three months after a lone golden cross, the index averaged a gain of 5.55%, and was higher 79.3% of the time. That's compared to an average anytime six-month gain of 2.85%, with a positive rate of 64.4%, looking at data since 1971.
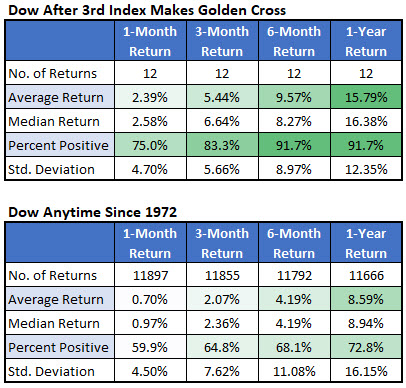
However, those returns are even better when the three big stock market barometers make golden crosses around the same time. There have been just 12 times since 1972 when all three indexes made a golden cross within one month, the last occurring in May 2016. For context, there have been 20 Dow golden crosses since 2000, 20 S&P golden crosses since 1979, and 20 Nasdaq golden crosses since 1987.
As we discussed in the aforementioned blog on Dow golden crosses, the blue-chip index has averaged a one-month loss after a lone golden cross, compared to an average anytime gain, looking at data since 1950. However, when the DJI, SPX, and IXIC make golden crosses within a 30-day span, the Dow averaged a one-month gain of 2.39%, and was higher 75% of the time. That outperformance continues looking 12 months out, when the Dow was up an average of 15.79% and higher 91.7% of the time.
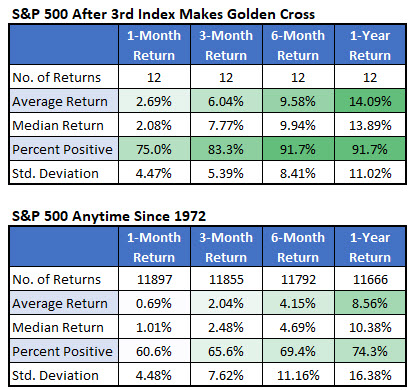
The same can be said for the S&P. A month after the trio made golden crosses, the SPX was up 2.69%, on average -- more than double its average gain after a lone cross, and nearly quadruple its anytime returns since 1972. One year after simultaneous crosses, the SPX was up 14.09%, on average, and higher 91.7% of the time -- also way better than after an individual cross and anytime.
Likewise, the Nasdaq shines when it makes a golden cross with its index peers. A month later, the tech-rich IXIC was up more than 5%, on average, and higher 75% of the time. That's almost double its average one-month gain after a lone golden cross. A year later, the Nasdaq was up a whopping 26.1%, on average, and in the black 91.7% of the time. That's compared to an average one-year gain of 16.75% after individual golden crosses, and 12% anytime.
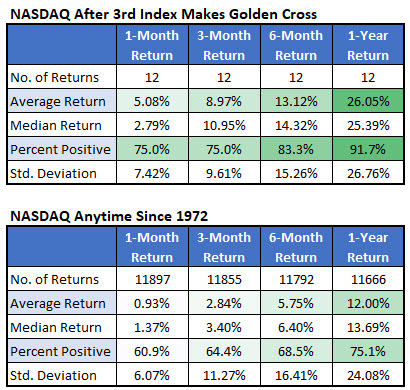
In conclusion, when the Dow, S&P 500, and Nasdaq all make golden crosses within 30 days of one another, the indexes tend to enjoy stronger-than-usual returns, likely as a reflection of continued broad-market strength. However, a risk to the bull case is the positioning of wrong-way Cboe Volatility Index (VIX) futures players, who are nearing an extreme in the short volatility trade, per Schaeffer's Senior V.P. of Research Todd Salamone. "Unfortunately, the timing of this vulnerability -- a VIX spike coincident with a market pullback -- is uncertain," he said, as the short volatility trade was in place for several months before the VIX exploded in 2017, but was popular for just a couple months ahead of the fourth-quarter 2018 sell-off.
