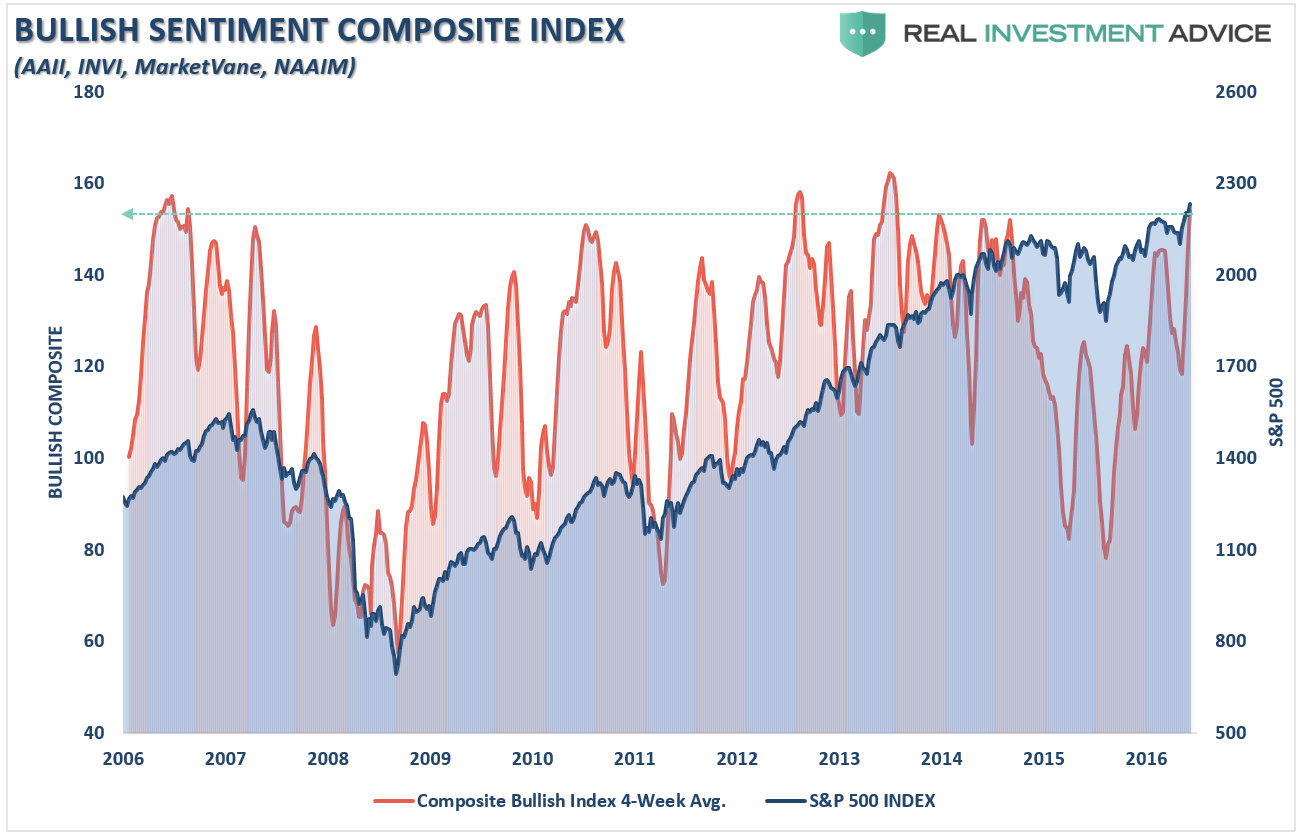
On Tuesday, I discussed the “excessive level of exuberance” which currently exists in the market since the election. To wit:
“It really isn’t surprising the majority of Wall Street analysts are bullish as prices have advanced improving their performance numbers for the year. Of course, since it is rising asset prices which drives their business – being “bullish” is good for business. (Telling investors to move to cash doesn’t create inflow for their firms or funds.) However, as investors, it is extremes in both ‘psychology’ and ‘behaviors’ that tend to give us the best indications as to future outcomes.
The legendary Bob Farrell had two rules specifically relating to today’s topic.
The first was Rule #9:
‘When all the experts and forecasts agree – something else is going to happen.’
While psychologically it may seem as the markets will rise indefinitely, the reality is they don’t. The reason is excesses are built when everyone is on the same side of the trade.
While there is ALWAYS both a buyer and seller to every transaction – it is at WHAT PRICE that matters. Ultimately, when a shift in sentiment occurs, the reversion is exacerbated by the stampede going in the opposite direction as a ‘vacuum’ at current prices form.”
Furthermore, as noted by Randy Frederick at Charles Schwab:
“It is a little scary to see such optimism. But at the same time, when I look out between now and the end of the year, I’m having a difficult time finding anything that’s probably going to derail this market outside of a black-swan event.
The only thing I’m worried about is that it seems like nobody is worried about anything right now.”
With virtually all S&P 500 equity put/call ratios in bullish territory, there is literally no one hedging against a potential market decline.
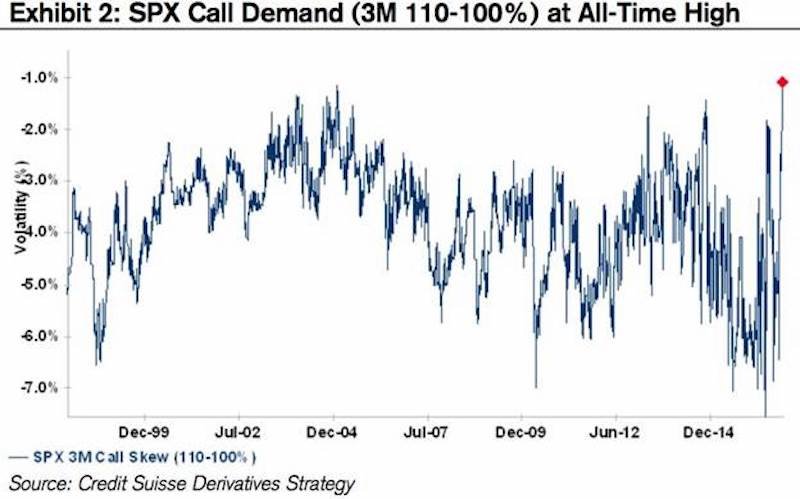
Then there is this:
“The stampede into U.S. equity ETFs since the election has been nothing short of breathtaking,” said David Santschi, chief executive officer at TrimTabs. ‘The inflow since Election Day is equal to one and a half times the inflow of $61.5 billion in all of the last year. One has to wonder who’s left to buy.’”
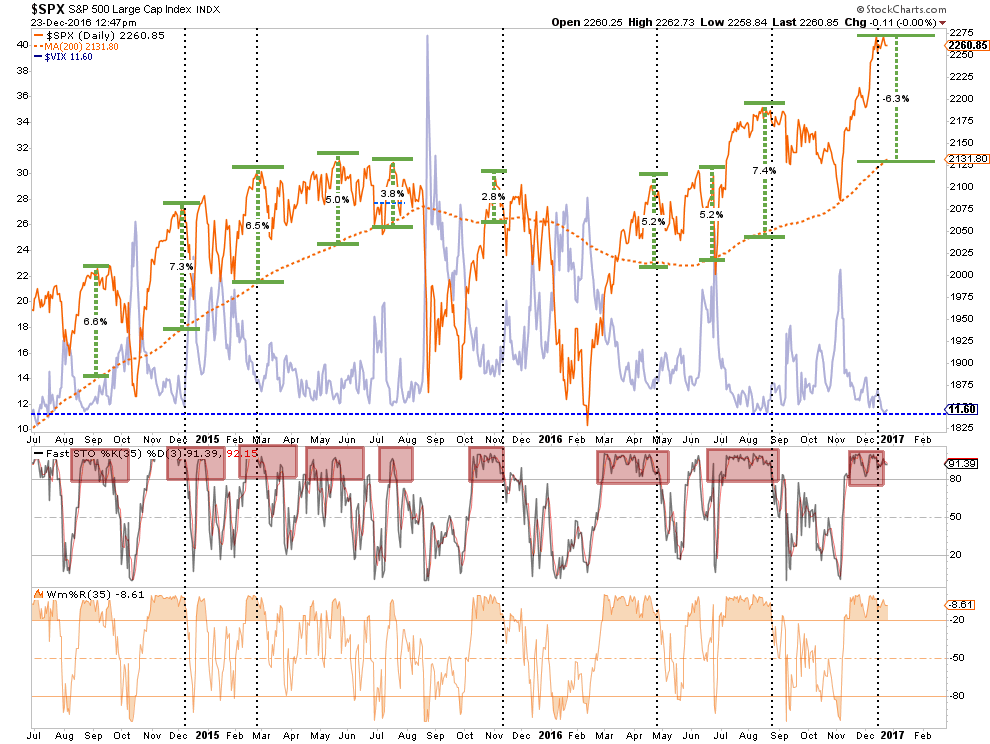
You can see this exuberance in the deviation of the S&P 500 from its long-term moving averages as compared to the collapse in the volatility index. There is simply “NO FEAR” of a correction in the markets currently which has always been a precedent for a correction in the past.
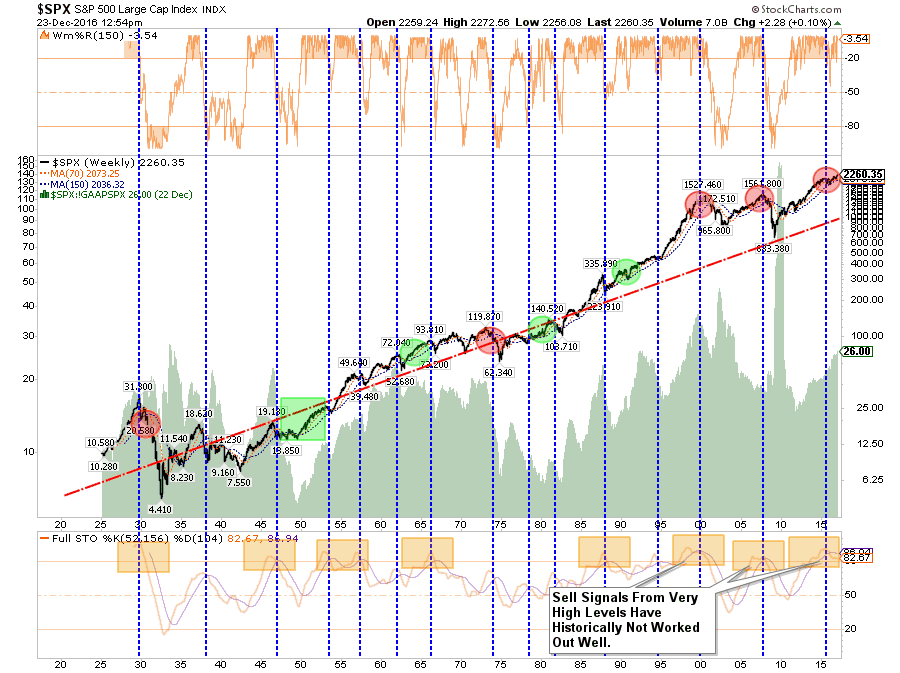
Furthermore, if we step back and look at the markets on a REALLY LONG-TERM basis there is currently little to suggest the changes to tax policy or regulations can provide for a substantive long-term increase in the price of the index from current valuation levels.
The issue, as noted recently by David Rosenberg, is the excitement may have run too far ahead of reality. To wit:
“Yet I did a BNN interview on Monday on the market outlook and the conclusion (not from me, mind you) was that 2017 was going to be defined by what inflation was going to do.
Well, beyond base effects caused by the dramatic plunge in oil prices at the start of the year and the more recent bounce towards year-end, I don’t see a whole lot of upside to inflation. In fact, despite base effects taking the year-over-year trends higher near-term, I think we will close 2017 with consumer inflation, headline, and core, below 1.5% (though both will peak in the opening months of the year at 2.6% and 2.3% respectively).
The question is what sort of growth we get, and as we saw with all the promises from “hope and change” in 2008, what you see isn’t always what you get. What followed the 1980 election of Reagan (recession in the next 18 months), George H. W. Bush in 1988 (recession within two years), Clinton in 1992 (a near double-dip recession), George W. Bush in 2000 (recession within months) and Obama in 2008 (the worst recovery of all time) shows one thing and one thing only when it comes to elections (keeping in mind that it is completely normal to have a market bounce between election day and inauguration day).
There are strong grounds to fade this current rally, which has more to do with sentiment, market positioning, and technicals than anything that can be construed as real or fundamental.
There is perception and then there is reality. Perception is unequivocally bullish. But spending intentions on both autos and housing actually both fell a point. Go figure.”
David is right. While consumer confidence has soared since the election, inflationary expectations have plummeted towards lows. Someone is going to be wrong, typically it’s the market.
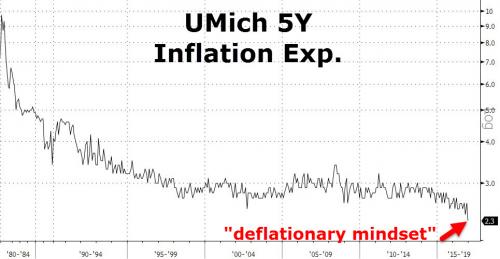
Here is the point. Exuberance on a post-Obama economy is terrific. Increases in optimism makes everyone “feel” better. However, when it comes to investing your hard earned money into a speculative market, separating the “emotion” of optimism from the “reality” of underlying fundamentals is crucially important.
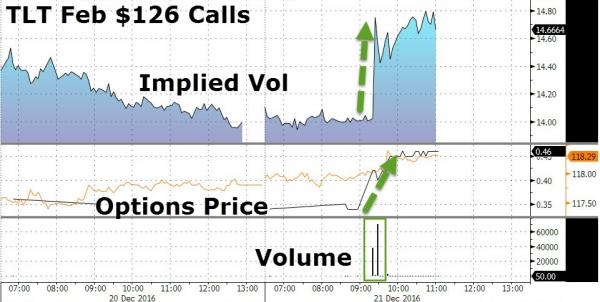
And despite the media’s incessant ravings of how the great “bond bull market” is dead, you may want to pay attention to the positioning of traders before you dump your fixed income holdings.
“It appears not everyone is convinced that “the 30-year bond bull is dead.” A quick glance across US equity options today shows TLT (the long-end Treasury Bond ETF) is the most active with call volumes (bullish bonds, lower rates) more than double their average, with over $1.3 billion notional in February $126 Calls (which will pay off if rates drop to around 2.00% by then).”
The following chart is net positioning in the 10-year. Note that all peaks in net positions have led to an eventual decline in rates.
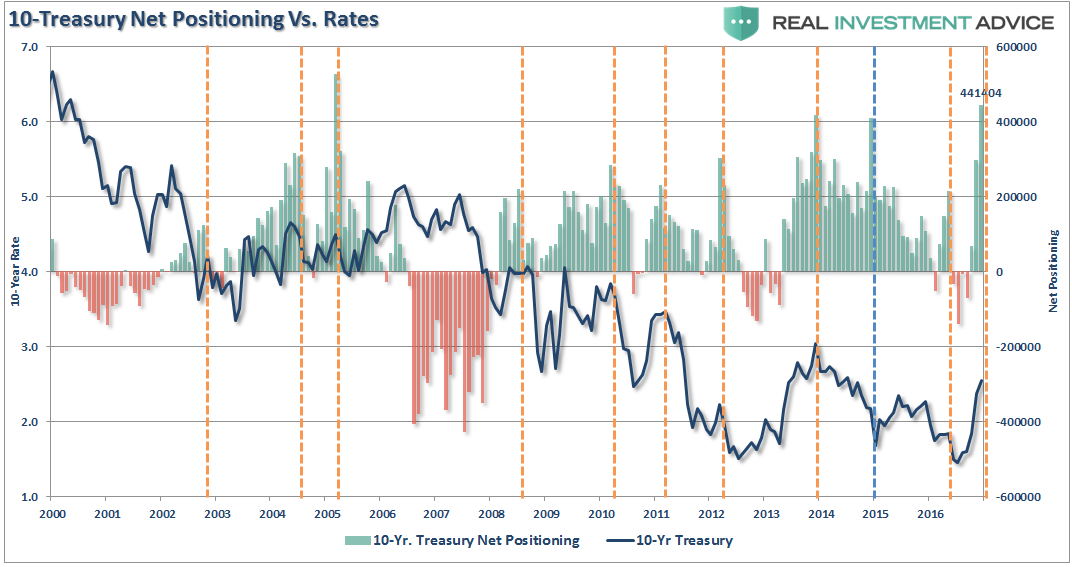
This is why, despite the short-term bump up in rates on “expectations,” I have been adding interest rate sensitive positions to portfolios over the last month. If the market reverses in January or February, as I suspect, these reduce the risk to the long side of the portfolio.
Market & Sector Analysis
Data Analysis Of The Market & Sectors For Traders
S&P 500 Tear Sheet
Thank you for your recent suggestions, while not all requests are possible to fulfill due to data limitations, I do appreciate the input.
Update: As requested, I have added price momentum analysis for S&P 500, 400, and 600 indices.
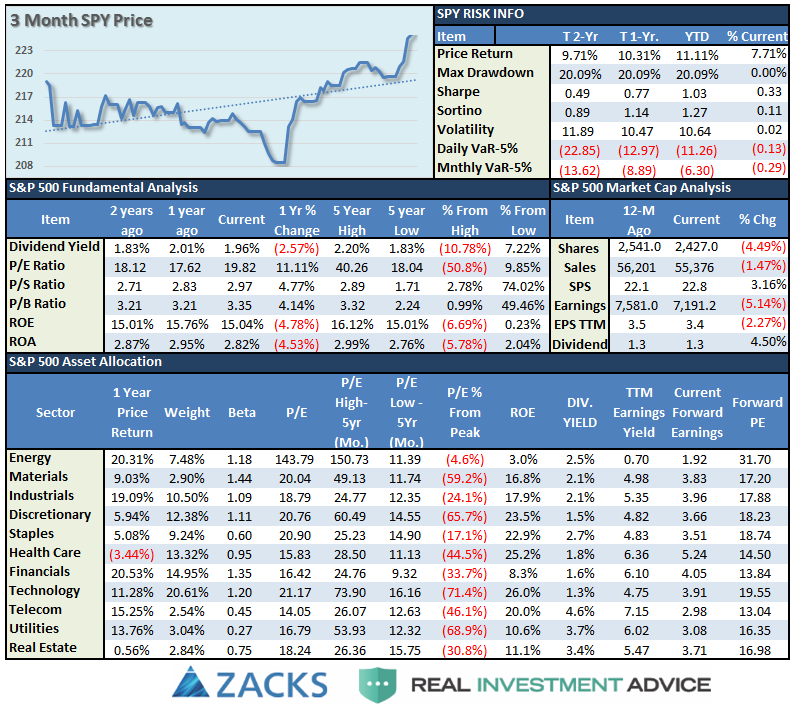
Sector Analysis
Comments
For a second week running, the market struggled but, as opposed to last week’s 1.46 point plunge, the market rocketed higher by 3.5 points to finish the week up 0.15%. (#sarcasm alert). Financials continued to lead the charge the last week, and remain extremely overbought. Profit taking remains highly recommended. Small and Mid-cap stocks, Energy, Materials, and Industrials outperformed the index as well. The problem, as stated above, is that a stronger dollar and higher interest rates will likely hamper this optimism sooner rather than later. This is particularly the case with Small and Mid-Cap companies that are the most susceptible to monetary tightening.
(Note: I have changed the sector and major market analysis charts to a 50/200 DMA crossover signal and embedded an overbought/sold indicator.)
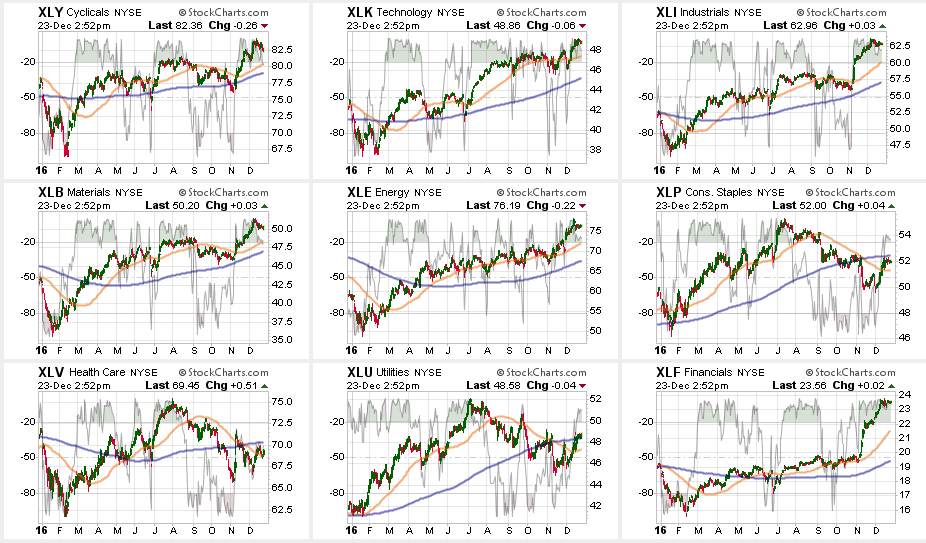
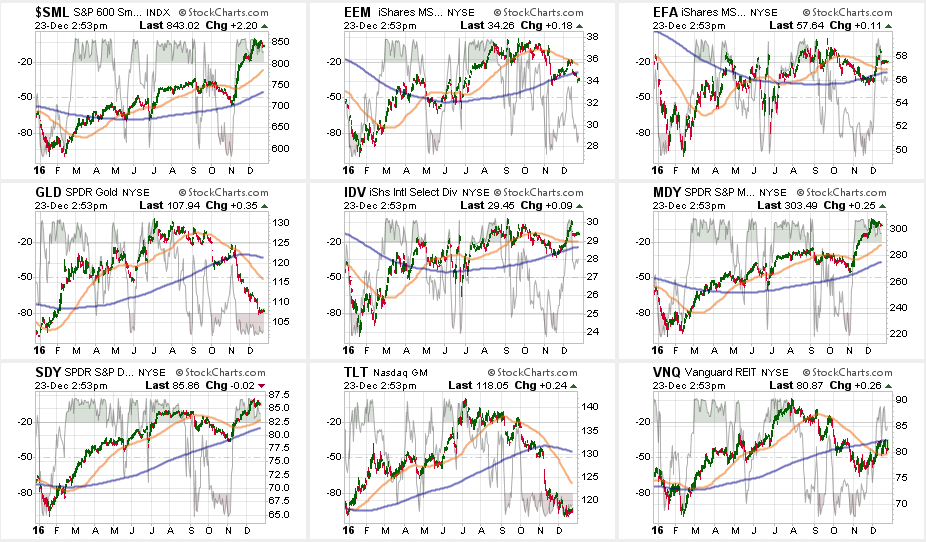
The table below shows thoughts on specific actions related to the current market environment. (These are not recommendations, just ideas related to market extremes and contrarian positioning within portfolios. Use at your own risk and peril.)
Over the last couple of weeks, as suggested, we have continued to hedge our long-equity positions with deeply out-of-favor sectors of the market (Bonds, REITs, Staples, Utilities) which paid off well during the volatility last week.
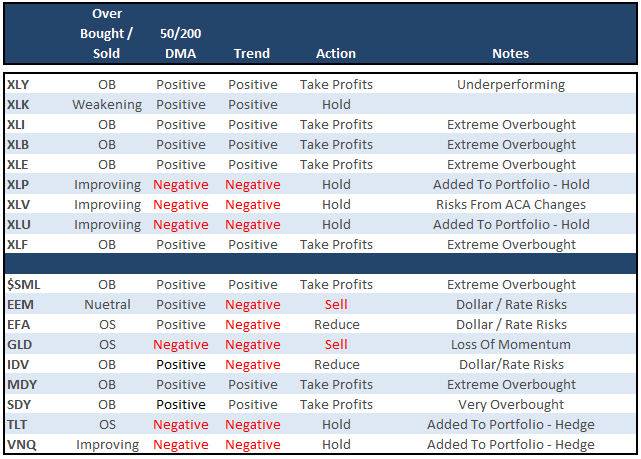
As I have been warning over the last couple of months, the stronger dollar and the rise in rates should not be dismissed.
Everything is currently pointing to this being a very late stage advance, so profit taking, hedging, and rebalancing is strongly advised.
