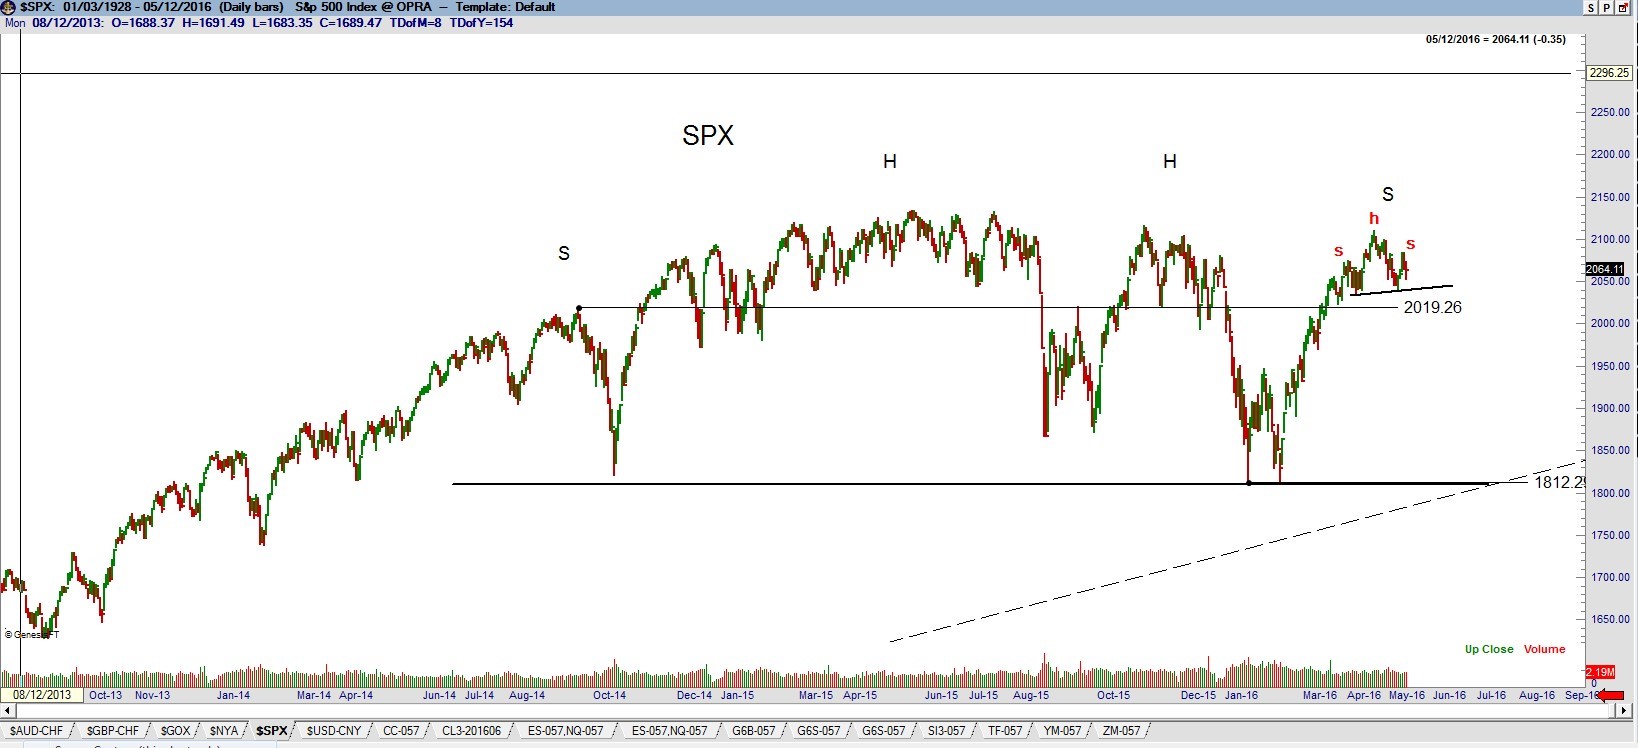
It is with some discomfort that I am always pointing out potential tops in the U.S. stock market indexes. But, I must call them as I read them. The S&P 500 daily chart has made ZERO upward progress in 18 months. A possible complex H&S top formation is under construction. Also note the appearance of a 7-week H&S top pattern. I am willing to short this smaller H&S pattern if given a well-defined risk point. I will give up on a bearish interpretation of the S&Ps if a new high is made – but this does not mean I would have any interest in being long in new high territory.
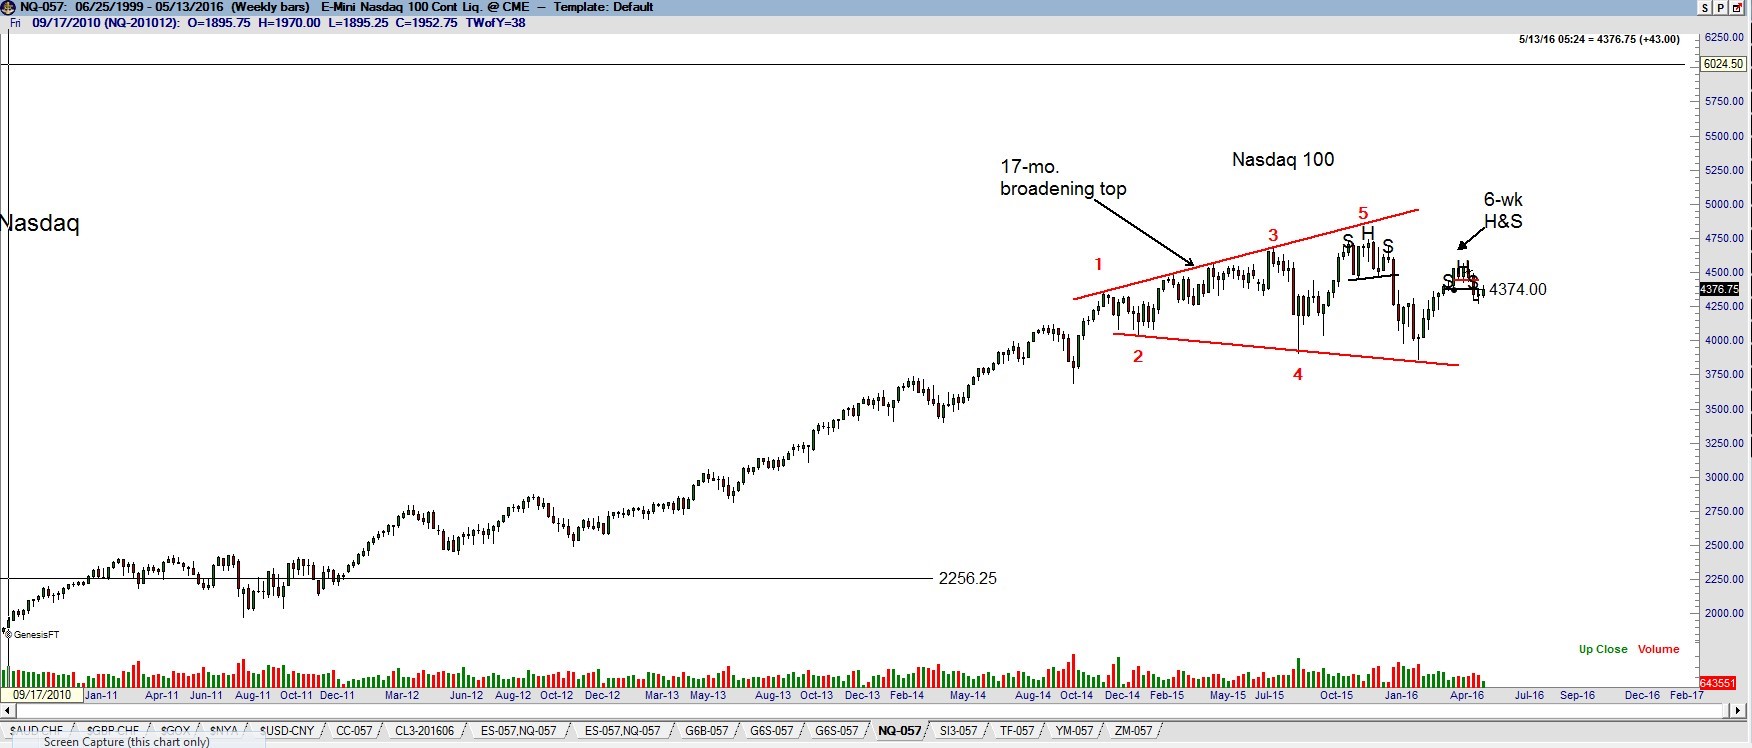
The NASDAQ Composite is tracing out a possible broadening top, although as I have pointed out in recent updates, the rally from the Feb 2016 low has exceeded the normal construction of a true broadening top. Outside of the Nifty (India), the Dow Utilities (dividend play) and the Japan Mothers Index, I have a hard time finding a futures market index I am willing to own.


