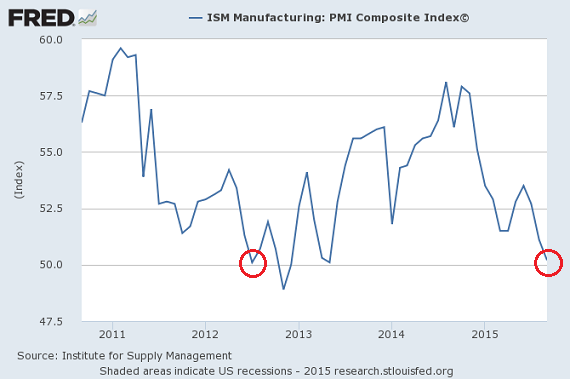
By July of 2012, a wide range of indicators suggested that the U.S. economy was flirting with trouble. Job growth was decelerating. Business investment was deteriorating. Meanwhile, manufacturing via the ISM Manufacturing Survey (PMI) was flirting with contraction.
Up until that moment in time, the Federal Reserve had already left rates at zero percent for three-and-a-half years. What’s more, they had already created trillions of electronic dollars to acquire government debts and push borrowing costs to unfathomable lows to ward off a double-dip recession (i.e., “QE1,” “QE2,” “Operation Twist”). However, the end of those programs seemed to show that the U.S.economy was still too fragile to stand on its own.
Not surprisingly, leaked rumors about a more awe-inspiring economic jolt began taking over the July 2012 business headlines. Terms like “QE3, “QE Forever,” and “QE Infinity” had been making the rounds. Indeed, by September of 2012, The Fed had unleashed an open-ended bond buying program that rivaled anything investors had seen previously.
Fast forward three years. Once more, the U.S. economy is flirting with trouble. The percentage of 25-54 year-olds (19.5%) that are out of work has risen sharply. (Retirees? College students?) Median household income is sagging. Business investment in research, plants, equipment and human resources development is virtually non-existent, with virtually all after-tax profits going to share buybacks and shareholder dividends. Non-revolving consumer credit has grown from 14.6 percent of after-tax income at the end of the recession (6/2009) to 18.7 percent (6/2015). And manufacturing via PMI? Falling throughout 2015 and hanging on by a thread (50.2), we’re right back to the type of environment that prompted previous calls for more quantitative easing (QE) “cowbell.”
From an investment standpoint, the demand for U.S. Treasury bonds in recent government auctions still points to risk aversion. Recall Monday’s 3-month T-Bill auction (10/5) where $21 billion had been acquired at 0%. Zero percent! It was the lowest yield for the 3-month T-bill on record. On Wednesday (10/7), another $21 billion went to auction on 10-year Treasury bonds. The high yield of 2.066% was the lowest since April. Equally worthy of note (no pun intended), the indirect bidding component that includes significant central banks acquired $13.1 billion (62.2%) – the second highest percentage on the record books.
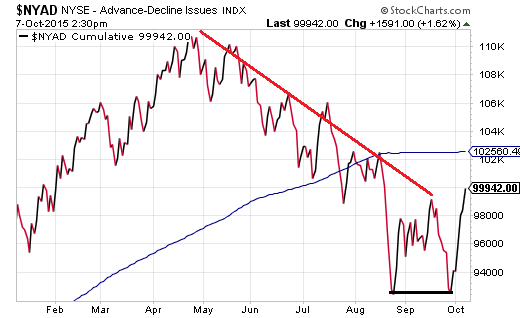
On the other hand, euphoria on the high probability that the Fed will abstain from 2015 rate hikes has given hope that a 4th quarter rally may materialize. For instance, the New York Stock Exchange (A/D) Line shows September’s successful retest of the August lows. Remember, it was the A/D Line that foreshadowed the dramatic sell-off in the S&P 500 SPDR Trust (NYSE:SPY) before its mid-August arrival. Higher lows and higher highs on the A/D Line from here forward would likely signal a shift in attitude toward greater risk taking.
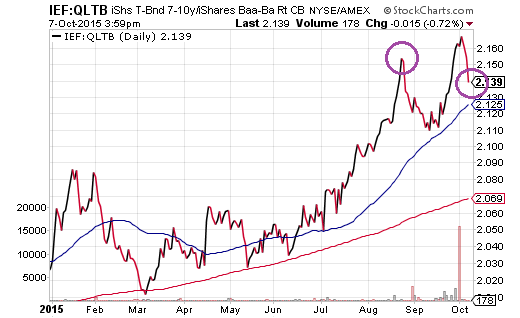
Another trend that is worth watching? Consider the relationship between U.S. Treasuries and crossover corporates – U.S. company bonds that straddle the line between low-end investment grade (Baa) and higher-rated “junk” (Ba). A rising price ratio for iShares 7-10 Year Treasury Bond ETF (NYSE:IEF):iShares Baa-Ba Rated Corporate Bond ETF (NYSE:QLTB) is a sign a of risk aversion. Granted, IEF:QLTB is still rising alongside its 50-day trendline. On the other hand, the fact that IEF:QLTB is lower than it was in August may be a sign that risk taking is on its way back. Put another way, a tightening in spreads between treasuries and crossover corporates would be a sign that investors might be looking for a return on capital again, rather than a return of capital alone.
Indeed, the battle between risk-on and risk-off has reached a crossroad. Many of the significant stock ETF proxies – S&P 500 SPDR Trust (SPY), iShares Russell 2000 (NYSE:IWM), Vanguard FTSE All-World (NYSE:VEU), Vanguard Europe Pacific (NYSE:VEA) rest near resistance levels of 50-day moving averages. Similarly, the S&P 500 itself fights to reclaim the psychological level of 2000, while the Dow Jones Industrials toils to climb back above a psychological level of 17,000.
Keep in mind, though, analysts widely anticipate earnings and revenue declines for the third consecutive quarter. If investors push prices much higher from existing levels, they’d be back to exorbitant P/E and P/S multiples. And if recent history is any guide on investor comfort will overvalued equity valuations, investors would not take kindly to a 4th quarter rate hike campaign; that is, the financial markets tens to support extreme overvaluation when the Fed is in “stimulus” mode.
A three-month stock celebration (Oct-Dec) may come down to these factors: (1) the Fed stays at the zero-bound, (2) the 10-year stays at 2%-2.25% to keep the credit bubble blowing, and (3) the earnings and revenue picture surprises at the flat-line, as opposed to disappointing with sharper than projected deterioration. In the meantime, pay attention to the market internals via the A/D Line as well as the spreads between treasuries and corporates.
Disclosure Statement: ETF Expert is a web log (”blog”) that makes the world of ETFs easier to understand. Gary Gordon, MS, CFP is the president of Pacific Park Financial, Inc., a Registered Investment Adviser with the SEC. Gary Gordon, Pacific Park Financial, Inc., and/or its clients may hold positions in the ETFs, mutual funds, and/or any investment asset mentioned above. The commentary does not constitute individualized investment advice. The opinions offered herein are not personalized recommendations to buy, sell or hold securities. At times, issuers of exchange-traded products compensate Pacific Park Financial, Inc. or its subsidiaries for advertising at he ETF Expert website. ETF Expert content is created independently of any advertising relationship.


