Tuesday March 20: Five things the markets are talking about
European stocks trade mixed despite a U.S tech equity selloff fading and as the market turns its attention to this week’s Fed rate decision and potential new trade tariffs from President Trump targeting China. The U.S dollar is steady while sovereign bonds fall.
The market has priced in a +100% probability of a +25-bp rate hike at the conclusion of the FOMC’s two-day meeting tomorrow (02:00 pm). But, will there be a shift in the dot plot?
Recent U.S. data and Fed speeches would suggest the median of FOMC participants’ assessment of the appropriate pace of policy firming (the dots) will unite around +2.125% or three-hikes for 2018, with an outside risk the median dot will move to +2.375%.
Also posing a risk to dollar and yield curve positions is the possibility the median dot for 2019 has moved up towards +3.125%, signifying a belief among FOMC participants that four additional rate hikes will be appropriate next year.
1. Asian equities mixed
In Japan, the Nikkei share average fell overnight as domestic tech stocks tracked their U.S counterparts’ declines, but declines were limited as the market refrained from taking large positions before tomorrow’s Fed’s rate decision. The Nikkei dropped -0.5%, while the broader Topix shed -0.2%.
Down-under, Aussie shares closed lower in light trade, with commodity stocks pressured by concerns President Trump could impose more protectionist trade measures. The S&P/ASX 200 index fell -0.4%. In S. Korea, the Kospi stock index erased early losses overnight as domestic institutions’ purchases gave support. The Kospi was up +0.42%.
In Hong Kong, stocks were little changed, as investors braced for Chairman Powell’s first policy meeting starting later today. At the close, the Hang Seng index rose +0.1%, while the China Enterprises Index lost -0.5%.
In China, stocks end higher as healthcare firms shine and as Beijing pledges further market opening as talk of trade war mounts. At the close, the Shanghai Composite index was up +0.3%, while the blue-chip CSI300 index was up +0.08%.
In Europe, regional indices drift into negative territory tracking U.S futures lower, with the Nasdaq continuing to underperform as tech stocks remain in focus following privacy backlash.
U.S stocks are set to open in the ‘red’ (-0.2%).
Indices: Stoxx600 -0.1% at 373.3, FTSE +0.1% at 7051, DAX -0.2% at 12198, CAC 40 -0.2% at 5211, IBEX-35 -0.5% at 9618, FTSE MIB -0.1% at 22608, SMI -0.4% at 8776, S&P 500 Futures -0.2%
2. Oil prices rise on Middle East tension, gold lower
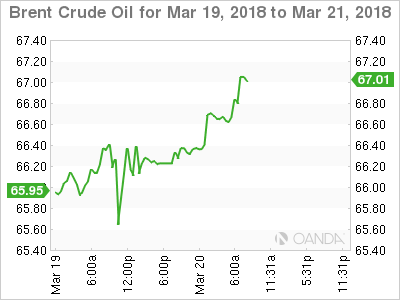
Oil prices are better bid, lifted by a mixed dollar, tensions in the Middle East and concerns of a further fall in Venezuelan output.
Brent crude futures are at +$66.53 per barrel, up +48c, or +0.7%, while U.S. West Texas Intermediate (WTI) crude futures are at +$62.61 a barrel, up +55c or +0.9%, from Monday’s close.
The IEA said last week that Venezuela, where an economic crisis has cut oil production by almost -50% to well below +2m bpd was “clearly vulnerable to an accelerated decline”, and that such a disruption could tip global markets into deficit.
Capping prices somewhat is U.S crude oil production, which has risen by more than a fifth since mid-2016, to +10.38m bpd.
Note: U.S. output is now higher than that of top exporter Saudi Arabia. Only Russia produces more, at around +11m bpd, although U.S output is expected to overtake Russia’s later this year.
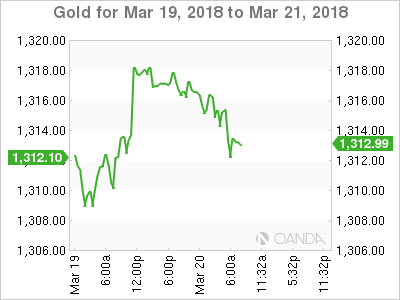
Ahead of the U.S. open, gold prices have inched lower on firmer dollar ahead of today’s two-day Fed meeting. Spot gold is down -0.1% to +$1,314.98 per ounce. In the previous session, it touched +$1,307.51 an ounce, its lowest since March 1.
3. Sovereign yields little changed
U.S. Treasury yields traded flat yesterday as investors look to bonds for safety. The yield on the U.S. 2-year note hit a high yield of +2.32%, its highest level since Sept. 9, 2008, when the 2-year yielded as high as +2.375%.
Note: Fed-funds futures are pricing in a +35% chance that the Fed will boost rates four times this year, up from +34% a week ago.
The Bank of Japan (BoJ) Summary of Opinions released Monday indicated that the +2% price target was still distant. Additional easing would be needed if there were a risk that achieving price target would be delayed. One board member said further yen appreciation (¥106.21) and stock declines could curb Capex and consumer spending, which could delay hitting inflation target.
Down-under, yesterday’s RBA march meeting minutes suggested that financial market pricing continued to imply that the cash rate was expected to remain unchanged during 2018, with a +25 bps increase expected in H1 of 2019
In Korea, concern amongst Bank of Korea board members over softer-than-expected inflation so far this year is growing. Minutes from the central bank’s Feb. 27 meeting showed board members expect inflation to probably miss the bank’s earlier-projected pace of +1.5% for H1 and likely lag far behind the bank’s +2% annual target. The subdued inflation reflects still-frail private consumption despite a solid recovery in exports. The bank has kept policy unchanged since its first rate increase in more than six-years.
The yield on U.S. 10-year Treasuries has rallied +1 bps to +2.87%. In Germany, the 10-year Bund yield has backed up +2 bps to +0.58%, while in the U.K., the 10-year Gilt yield has climbed +2 bps to +1.445%.
4. Dollars mixed results
Trade and tariffs remain to the fore. An escalation on trade issues is now seen entering its next stage with the U.S. administration considering imposing a +$60B tariff on China’s +$510B of exports into the U.S. by the end of the week.
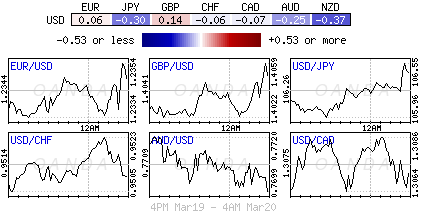
USD/JPY (¥106.34) has moved higher after Japanese officials noted that the country would/could secure some exemptions from U.S. tariffs on steel and aluminum on per-item basis. The overnight high print (¥106.60) came after the new BoJ Deputy Governor Amamiya peddled the standard BoJ rhetoric. He also noted that he saw no need to consider rate hikes at this time, but did not rule out adjusting rates before hitting inflation target.
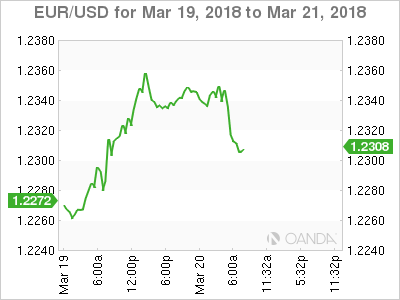
EUR/USD (€1.2309) has maintained some of yesterday’s stamina when ECB officials had begun to shift the debate towards the steepness of the rate path with even the most dovish members accepting that QE should end this year.
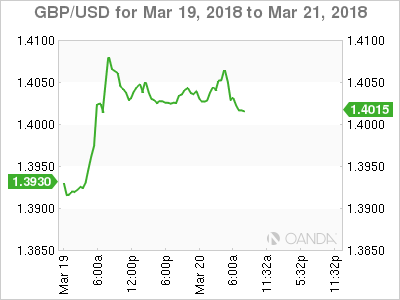
Sterling (£1.4025) fell after February’s U.K annual inflation print eased (see below). Weaker data may at the margins dampen expectations for future U.K. rate increases, but the market remains cautious before Thursday’s BoE policy announcement.
5. U.K inflation eased in February
Data this morning showed that annual inflation in the U.K. slowed last month, as the effects of a steep decline in the pound began to fade.
Consumer prices rose +2.7% on the year in February, compared with a rise of +3% a month earlier.
The decline reflected a fall in gas prices and weaker gains in prices of food and other goods than a year earlier.
Note: The fall in the pound following the Brexit vote pushed CPI above the BoE’s +2% target for most of 2017. The BoE is expected to hold rates steady on Thursday. The next move could come as soon as May.
Other data showed that wider inflationary pressures in the U.K economy eased in February, with the prices charged by companies at the factory gate (PPI) rising +2.6% on year, compared with a rise of +2.8% a month earlier. Firms’ raw material costs rose +3.4%, against a rise of +4.5% in January.
Which stock should you buy in your very next trade?
AI computing powers are changing the stock market. Investing.com's ProPicks AI includes 6 winning stock portfolios chosen by our advanced AI. In 2024 alone, ProPicks AI identified 2 stocks that surged over 150%, 4 additional stocks that leaped over 30%, and 3 more that climbed over 25%. Which stock will be the next to soar?
Unlock ProPicks AI