The halfway point of 2017 is nearly upon us and as investors consider market dynamics, there is much to be both excited and worried about. The following are some of the most interesting charts on my radar right now and their implications for your portfolio.
PowerShares QQQ (NASDAQ:QQQ)
In my opinion, no other major index can define the resilience of growth stocks better than the NASDAQ 100 over the last several years. This ebullient group of the 100 largest non-financial stocks on the NASDAQ Stock Exchange has now spent 137 trading days above its 50-day moving average. That’s a new all-time record according to Charlie Bilello of Pension Partners.
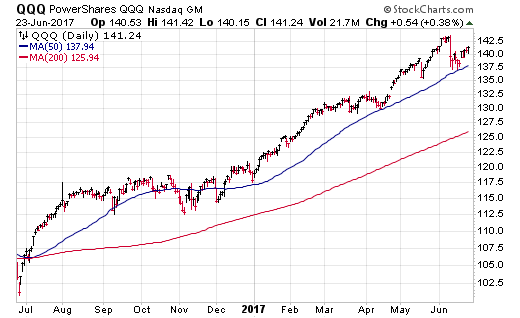
The momentum in large-cap technology, health care, and consumer discretionary stocks continues to be a powerful propellant for QQQ since the start of 2017. Until we receive some evidence to the contrary, it’s difficult to fight this trend or to attempt to call a top in the market overall. QQQ is now +20% so far this year versus just +9.77% in the SPDR S&P 500 ETF (NYSE:SPY).
iShares Russell 2000 ETF (NYSE:IWM)
It’s interesting to note that the strength in large, growth-oriented stocks hasn’t filtered down to smaller companies with a high beta to the S&P 500 Index. This category has traditionally been a source of momentum during sustained up-trends. However, it’s proving difficult for IWM to build any sort of trading edge to the upside this year.
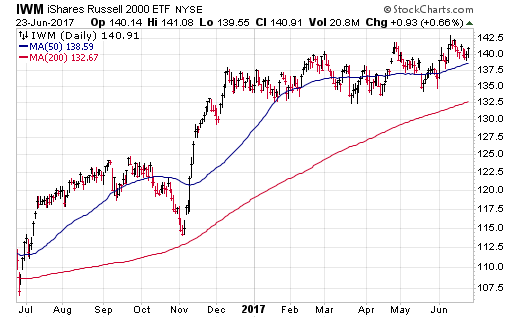
Continued sideways consolidation is not necessarily a bad thing and IWM has still managed to gain +4.79% through the first six months of 2017. I don’t consider the pattern of this index to be an overly worrying sign right now. However, it is worth noting that a break below the March low and 200-day simple moving average, around near $132.50, would be a cautionary signal.
iShares High Yield Corporate Bond ETF (NYSE:HYG)
Credit conditions continue to signal strength throughout the fixed-income markets with a healthy appetite for risk-taking. HYG has easily weathered a few small dips this year and just recently hit new all-time, dividend-adjusted highs.
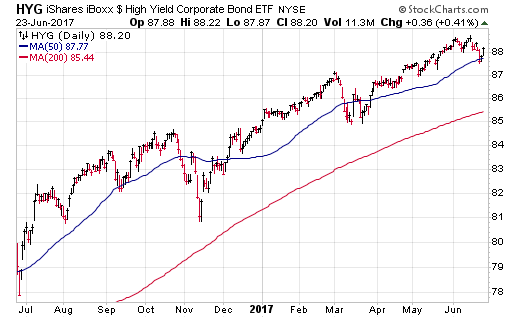
This diversified basket of junk bonds has gained 4% in total return for 2017, but the most interesting dynamic may be its rapidly falling income component. HYG now yields just 4.78% with an effective duration of 3.56 years and an option adjusted spread of 341 basis points.
The long road of credit recovery since the 2015 low has been good to active managers with an overweight position in credit-sensitive securities. The question now is: how much farther can that trend reasonably extend and what are the implications on the other side of that peak?
PowerShares DB Commodity Index Tracking Fund (NYSE:DBC)
The big theme in the commodity space has been the disappointing price action of crude oil, which peaked near the beginning of the year. This has weighed heavily on diversified commodity indexes such as DBC, which are heavily influenced by energy prices.
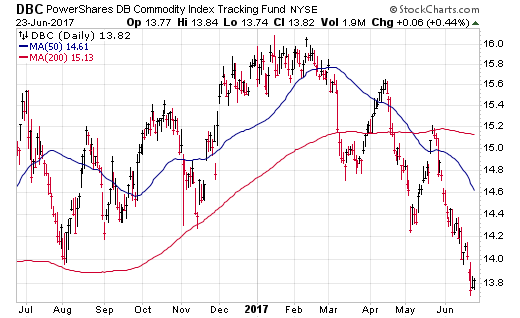
DBC is now off nearly -13% this year and hard-asset investors must be wondering when we are going to ultimately see a lift off in these markets. It’s been far more of a trader’s paradise than a diversified investors friend over the last half decade. Sub-par inflationary metrics and uncertain global demand dynamics continue to work against funds like DBC.
CBOE VIX Volatility Index (VIX)
I’m not one to endorse the application of technical analysis on the VIX, but it’s difficult to ignore the persistence of this fear index at or below the 10 level. The low volatility story has been very real and market participants are likely feeling emboldened for a second-half run of further gains in stocks.
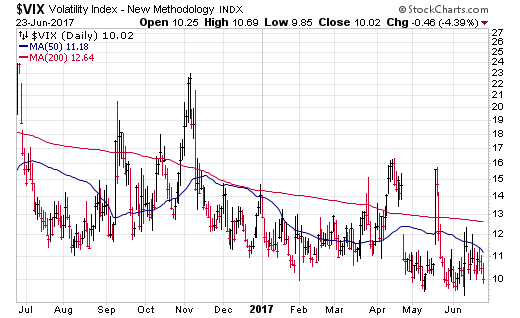
I would be surprised if we didn’t see additional spikes in volatility this year that provide fresh opportunities for capital on the sidelines or a simple churning of the market to shake out the weak hands.
Disclosure: FMD Capital Management, its executives, and/or its clients June hold positions in the ETFs, mutual funds or any investment asset mentioned in this article. The commentary does not constitute individualized investment advice. The opinions offered herein are not personalized recommendations to buy, sell or hold securities.
