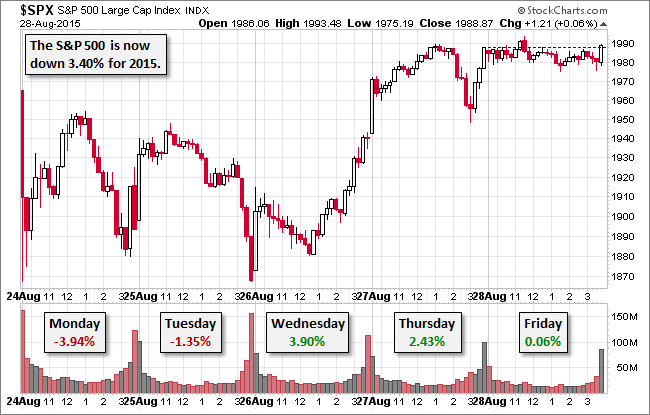
Before the market opened on Friday, the Shanghai Composite posted another big gain, up 4.82%, but the European indexes would close fractionally above the flat line (the Euro STOXX 50 up only 0.18%). Our benchmark S&P 500 followed the European exemplar, struggling throughout the day in a narrow range around (mostly below) the opening price. The index ended the day with a rally in the final minutes to eke out a tiny gain of 0.06%, ending a volatile week with a gain of 0.91%.
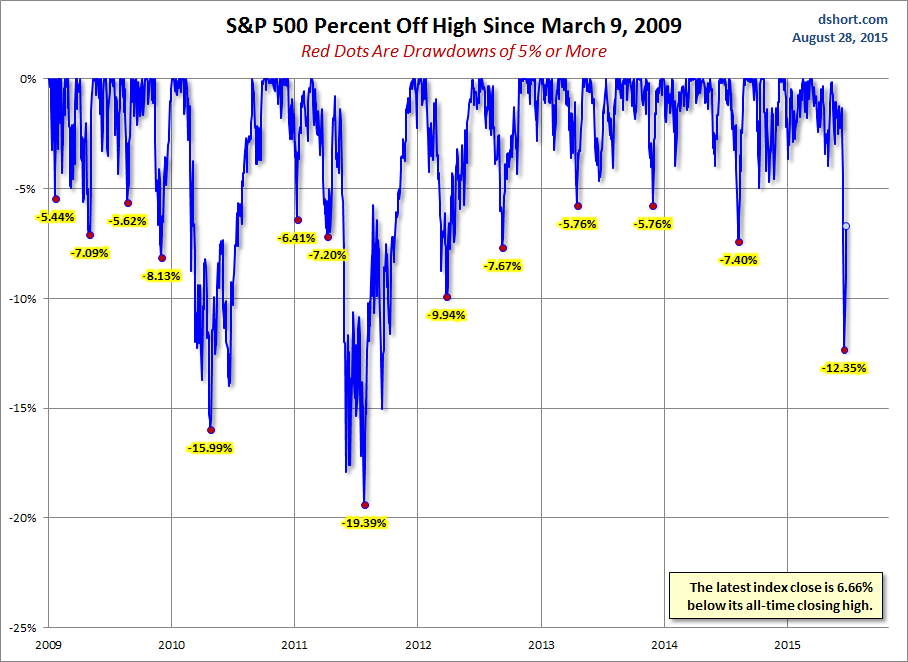
The 500 is now down 3.4% year-to-date and 6.66% off its record close.
The yield on the 10-year note closed at 2.19%, up one bp from Thursday's close.
Here is a snapshot of past five sessions.

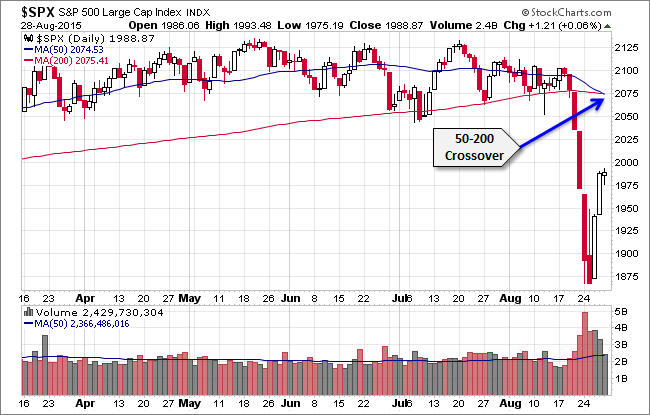
On a daily chart we see that volume has declined over the past three sessions, and the legendary"death cross" has occurred, with the 50-day price moving average falling fractionally below the 200-day moving average. We have one more market day in August. Is the correction over? Or will we see a September swoon?

A Perspective on Drawdowns
Here's a snapshot of selloffs since the 2009 trough.

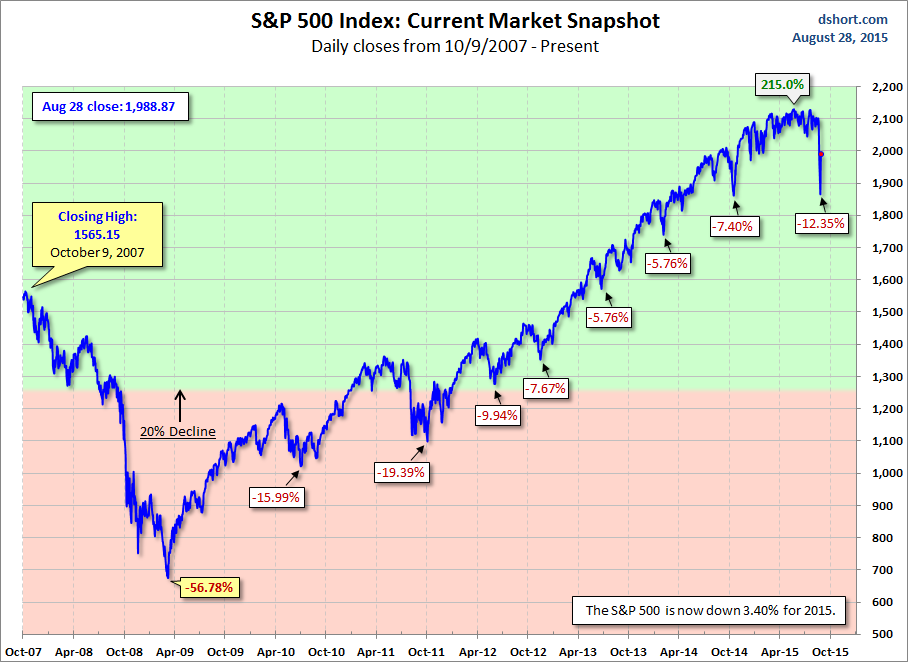
For a longer-term perspective, here is a charts base on daily closes since the all-time high prior to the Great Recession.

