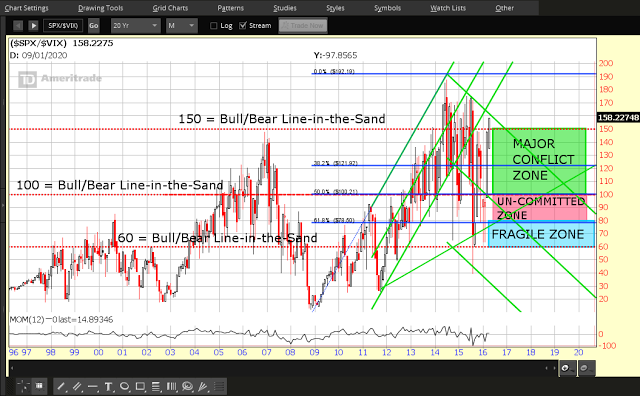
Further to my posts of here and here (with March 3 update), price action on the SPX:VIX ratio has rallied and is now in between major support of 150 and major resistance at 160, as shown on the following monthly chart. The momentum indicator has also risen above the zero level and is hinting of higher prices to come at some point on this longer term time frame.

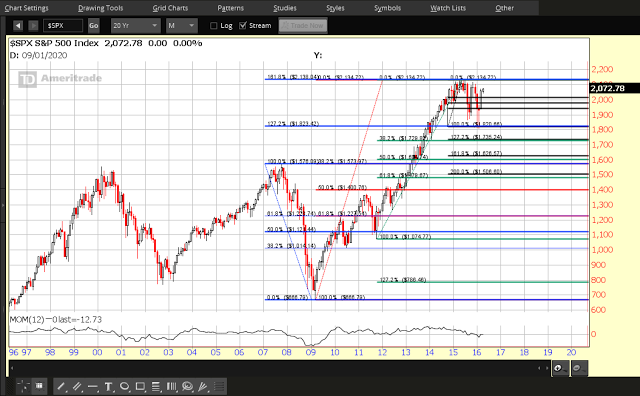
Equity bulls will need to keep the price on this ratio above the 150 level, as well as break and hold above 160, and keep momentum above zero, in order to convince traders/investors to continue their buying spree to send the SPX to new all-time highs (currently at 2134.72, as shown on the following monthly chart of the SPX).
Otherwise, a drop and hold below these levels will see volatility return to the equity markets -- likely in a substantial manner -- to send them to, potentially, new lows for the year. It should be noted that the momentum indicator on this chart is not yet above zero and is still in a downtrend, so it is not yet confirming that higher prices are in store for the SPX.
Keep a close eye on the SPX:VIX ratio for signals.

