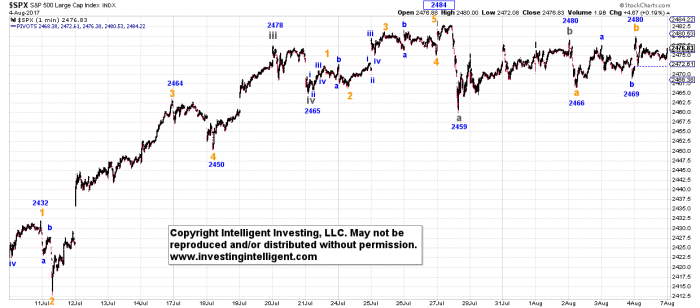
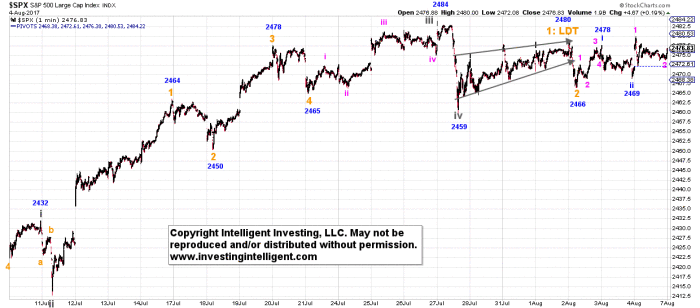
I apologize for the hiatus in updates, but I’ve been on vacation over the past weeks, and returned mid-last week. Anyway, in my past updates, I was looking for ideally one more drop and rally in the S&P 500 to SPX2485-2505 (see here). We got that to the T as the index hit an All-time-high (ATH) of SPX2484 on July 27 and then it dropped 1% intra-day only to end six trading sessions later flat and unable to move above the ATH. This clearly shows the importance of the SPX2485-2505 target zone, which are rounded numbers, as it is the Fib-confluence zone of four different wave degrees since the S&P500 struck the SPX1810 low February last year.
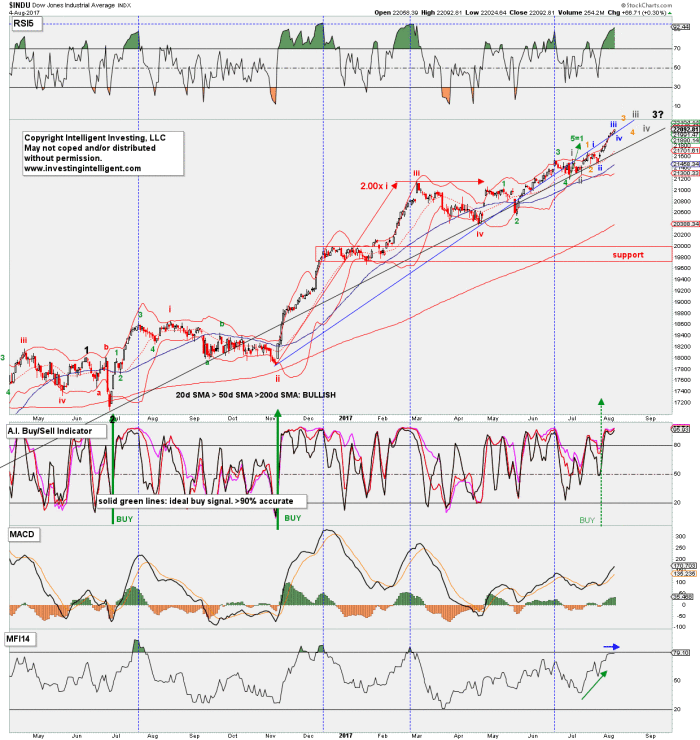
The Dow Jones, on the other hand, didn’t stop at $21,800 as I was looking for and forecasted (see here) and instead continued its march higher. This divergence between indices (not to mention the Russell 2000, which is only up ~5% YTD; underscoring the current “risk-on rally”).
Thus let’s take a look at both indices to see where we are. Regarding the S&P500 the two 1-minute charts below show; A) Major-3 topped at SPX2484 and the market has started it’s larger multi-week correction down to SPX2370-2300; or B) it needs one more wave ([grey] minute-v) up deeper into the SPX2485-2505 zone, with an ideal target of SPX2488-2502.

Now it can be that we’ll even see one more stab lower first to SPX2455 before the market rallies, but it’s not necessary. Thus we’ll let the market decide. Regardless, and as I’ve been telling my Premium Members for weeks, short term gains can be chased, but should be done so while keeping in mind that the upside potential is small (30-40p) compared to the downside risk (200-240p). A break below SPX2450 will be needed to place me fully in the “major-4 underway camp” and thus the index is indeed on close watch. So where does that leave the Dow Jones you may ask? Well, according to my analyses this index needs to wrap up a few more smaller 4th and 5th waves before topping in the similar degree major-3 wave. It clearly surpassed my ideal 2.000x Fib-extension at $21,800 as the final 5th wave is extending, which is impossible to foretell.
All the technical indicators on the Dow are pointing up, with the RSI5 on this chart close to peak momentum, which in the prior 3 occasions (blue vertical lines) coincided with 3rd, and 3rd of 3rd wave tops; in line with my preferred count shown. This tells us to expect higher prices going forward. Money flow is stalling at peak height as well, which also foretells of a 3rd wave peak. Does this mean the S&P500 therefore has to go up as well? No, as clearly the two indices have been misaligned for days. In addition, indices should be treated separately and 1-count does not fit all. But as shown, it’s certainly possible.
Not shown here, but my market breadth-based buy-sell indicator for the S&P500 turned to sell on Friday as breadth has been negative during four out of the past six days. This doesn’t mean the market can’t rally, but low-breadth to negative-breadth rallies are always suspect.
