S&P Breakdown From Bear Flag; Dow Technicals Net Bearish

Published 10/23/2018, 12:19 AM
Updated 07/09/2023, 06:31 AM
US500
-
DJI
-
US2000
-
IXIC
-
SOX
-

There was no acceleration in losses for the Russell 2000 and Semiconductor Index yesterday, instead it was the S&P 500's turn to break from its 'bear flag'. It was more of a technical break than an absolute loss but given net technical weakness, it must be respected.
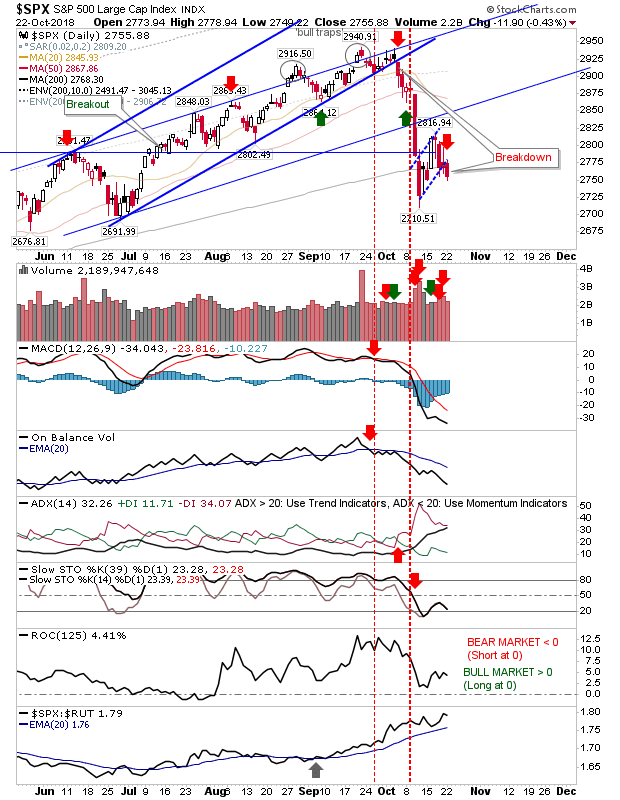
SPX Daily Chart


The Dow also broke from its 'bear flag' but the 200-day MA is available to lend support (already lost for the S&P). Other technicals are net bearish.
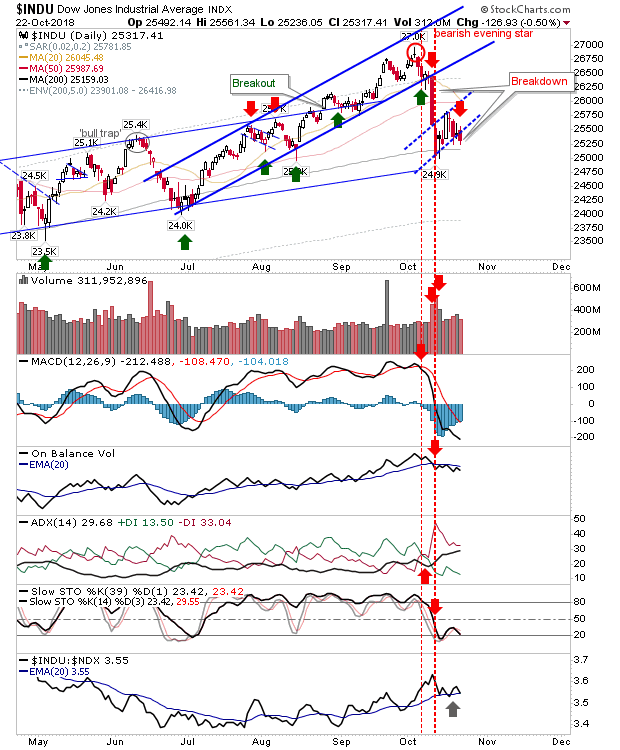
INDU Daily Chart

Tech Indices are caught in a mixed zone. Some may argue it has already lost 'bear flag' support; others may view it at continued support.
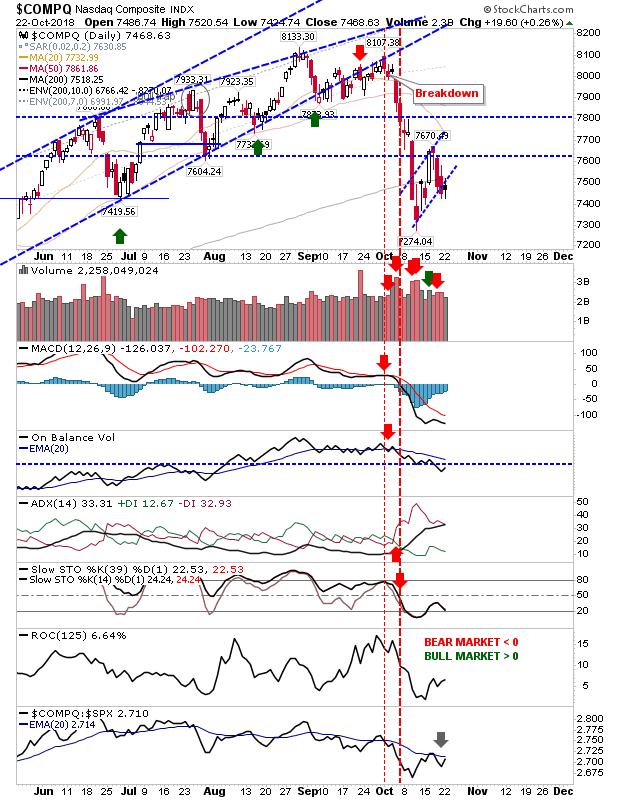
COMPQ Daily Chart


The Russell 2000 is down, trading at the recent swing low. Aggressive buyers could go long a move above 1,551 with a stop on a loss of 1,530.
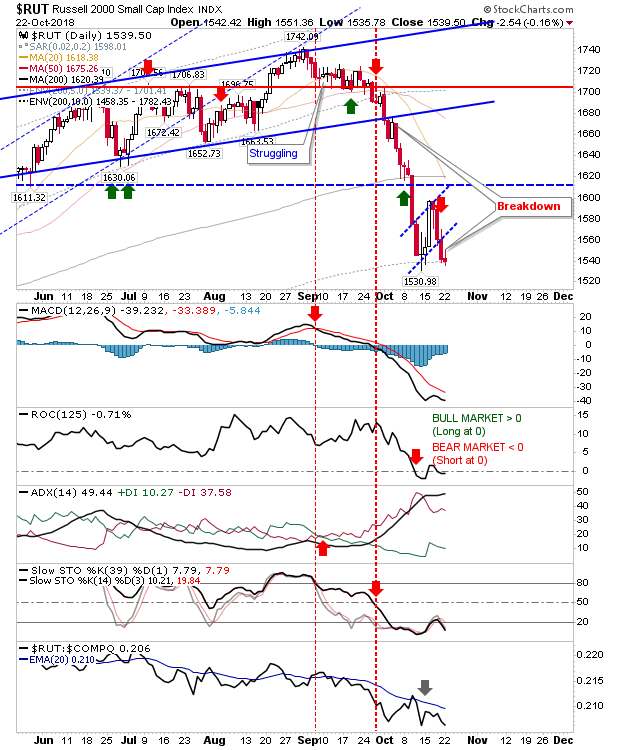
RUT Daily Chart

For today, yesterday's indecision probably reflects a reluctance for shorts to add to their positions and for bulls to 'sell.' This leaves the next move for buyers to come in and for shorts to cover.

The basis for a rally, and maybe a challenge of prior highs, looks to be in place. If you are a short, don't get greedy. If the 'bear flags' are to play to form then decent downside has to come soon, otherwise, it will trade out flat (and into a sideways consolidation).

Latest comments

Loading next article…
Risk Disclosure: Trading in financial instruments and/or cryptocurrencies involves high risks including the risk of losing some, or all, of your investment amount, and may not be suitable for all investors. Prices of cryptocurrencies are extremely volatile and may be affected by external factors such as financial, regulatory or political events. Trading on margin increases the financial risks.
Before deciding to trade in financial instrument or cryptocurrencies you should be fully informed of the risks and costs associated with trading the financial markets, carefully consider your investment objectives, level of experience, and risk appetite, and seek professional advice where needed.
Fusion Media would like to remind you that the data contained in this website is not necessarily real-time nor accurate. The data and prices on the website are not necessarily provided by any market or exchange, but may be provided by market makers, and so prices may not be accurate and may differ from the actual price at any given market, meaning prices are indicative and not appropriate for trading purposes. Fusion Media and any provider of the data contained in this website will not accept liability for any loss or damage as a result of your trading, or your reliance on the information contained within this website.
It is prohibited to use, store, reproduce, display, modify, transmit or distribute the data contained in this website without the explicit prior written permission of Fusion Media and/or the data provider. All intellectual property rights are reserved by the providers and/or the exchange providing the data contained in this website.
Fusion Media may be compensated by the advertisers that appear on the website, based on your interaction with the advertisements or advertisers.
© 2007-2025 - Fusion Media Limited. All Rights Reserved.