🐂 Not all bull runs are created equal. November’s AI picks include 5 stocks up +20% eachUnlock Stocks

S&P 500, Dow And Nasdaq Since 2000 Highs

Published 09/07/2017, 02:27 PM
Updated 07/09/2023, 06:31 AM
US500
-
DJI
-
SPY
-
IXIC
-

This update is in response to a standing request for real (inflation-adjusted) charts of the S&P 500, Dow 30, and Nasdaq Composite. It includes the latest monthly close data.

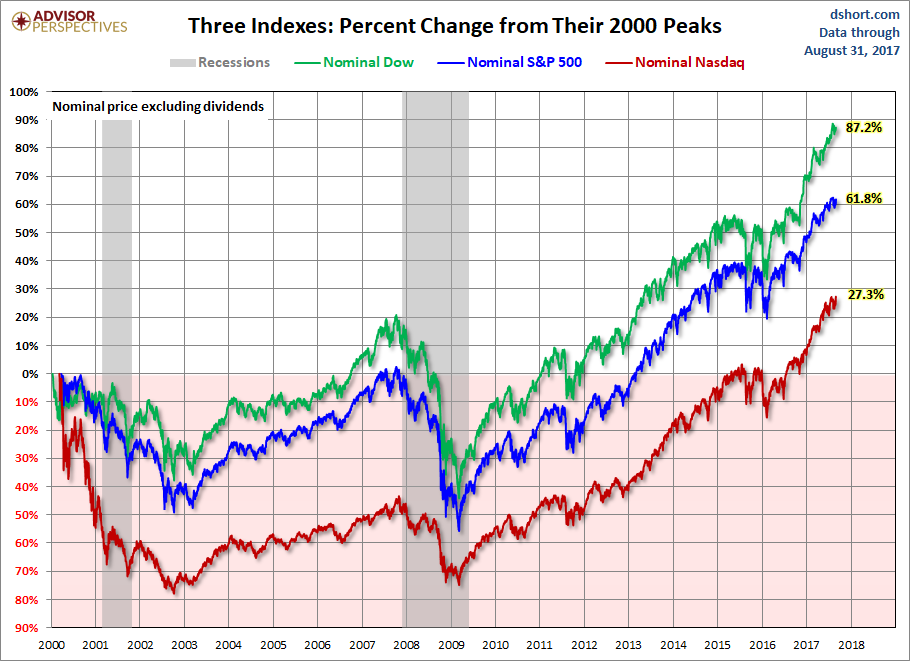
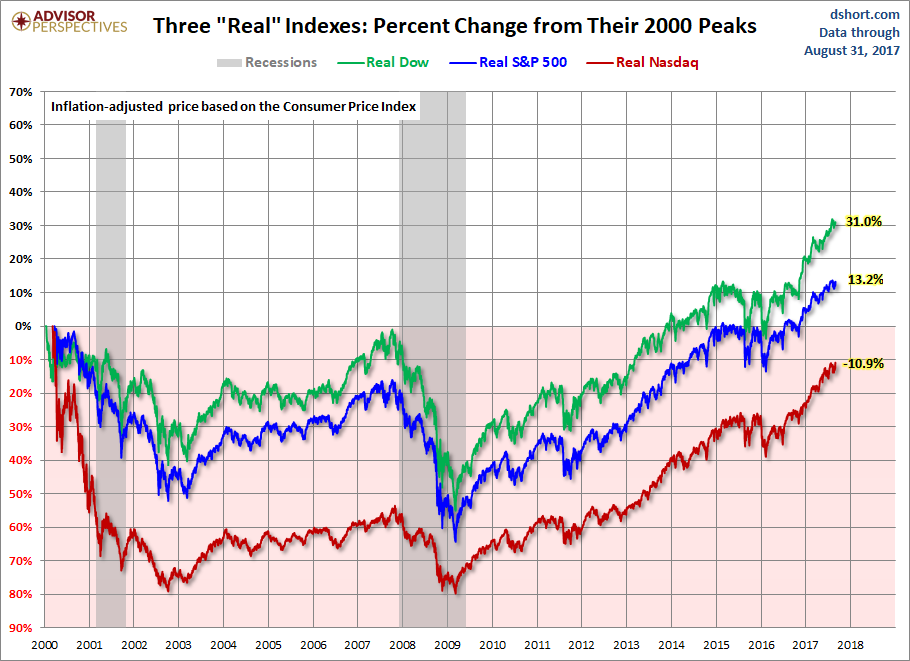
Here are two overlays — one with the nominal price, excluding dividends, and the other with the price adjusted for inflation based on the Consumer Price Index for Urban Consumers (which is usually just referred to as the CPI).
Nominal Dow, S&P 500 And Nasdaq

Real Dow, S&P 500 And Nasdaq

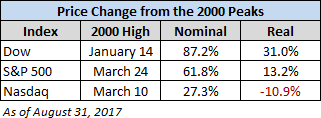
Price Change From 2000 Highs

The charts require little explanation. So far the 21st Century has not been especially kind to equity investors. Yes, markets do bounce back, but often in time frames that defy optimistic expectations.

Performance Of The SPY ETF

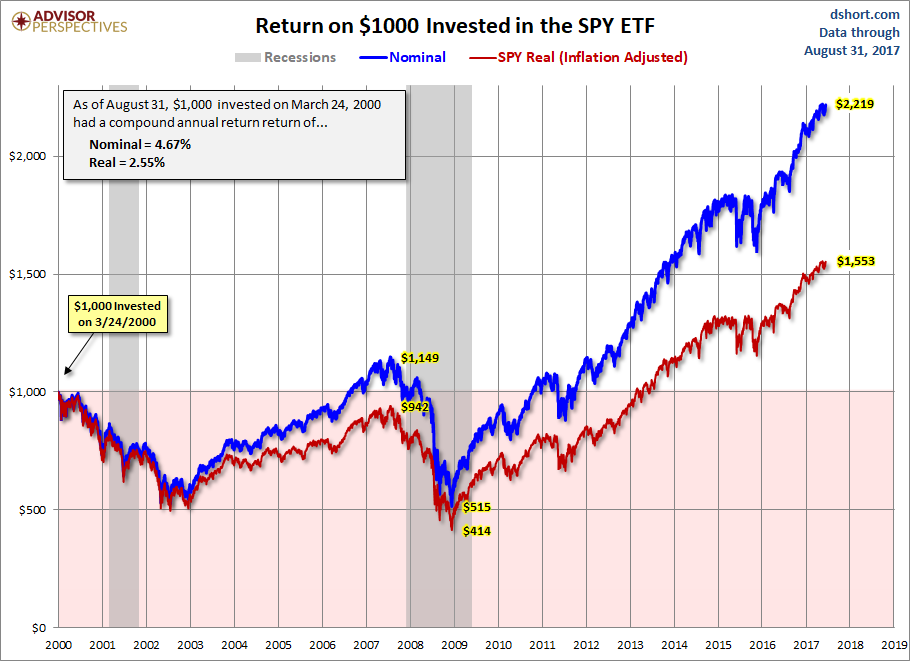
The charts above are based on price only. But what about dividends? Would the inclusion of dividends make a significant difference? Let's take a look at the return on $1,000 invested in the SPY ETF at its March 2000 peak.

SPDR S&P 500 Returns Since 2000

The total return certainly looks better, but the real (inflation-adjusted) purchasing power of that $1,000 is currently only 553 dollars above break-even, a real compounded annual return of 2.55%.

Latest comments

Loading next article…
Risk Disclosure: Trading in financial instruments and/or cryptocurrencies involves high risks including the risk of losing some, or all, of your investment amount, and may not be suitable for all investors. Prices of cryptocurrencies are extremely volatile and may be affected by external factors such as financial, regulatory or political events. Trading on margin increases the financial risks.
Before deciding to trade in financial instrument or cryptocurrencies you should be fully informed of the risks and costs associated with trading the financial markets, carefully consider your investment objectives, level of experience, and risk appetite, and seek professional advice where needed.
Fusion Media would like to remind you that the data contained in this website is not necessarily real-time nor accurate. The data and prices on the website are not necessarily provided by any market or exchange, but may be provided by market makers, and so prices may not be accurate and may differ from the actual price at any given market, meaning prices are indicative and not appropriate for trading purposes. Fusion Media and any provider of the data contained in this website will not accept liability for any loss or damage as a result of your trading, or your reliance on the information contained within this website.
It is prohibited to use, store, reproduce, display, modify, transmit or distribute the data contained in this website without the explicit prior written permission of Fusion Media and/or the data provider. All intellectual property rights are reserved by the providers and/or the exchange providing the data contained in this website.
Fusion Media may be compensated by the advertisers that appear on the website, based on your interaction with the advertisements or advertisers.
© 2007-2024 - Fusion Media Limited. All Rights Reserved.