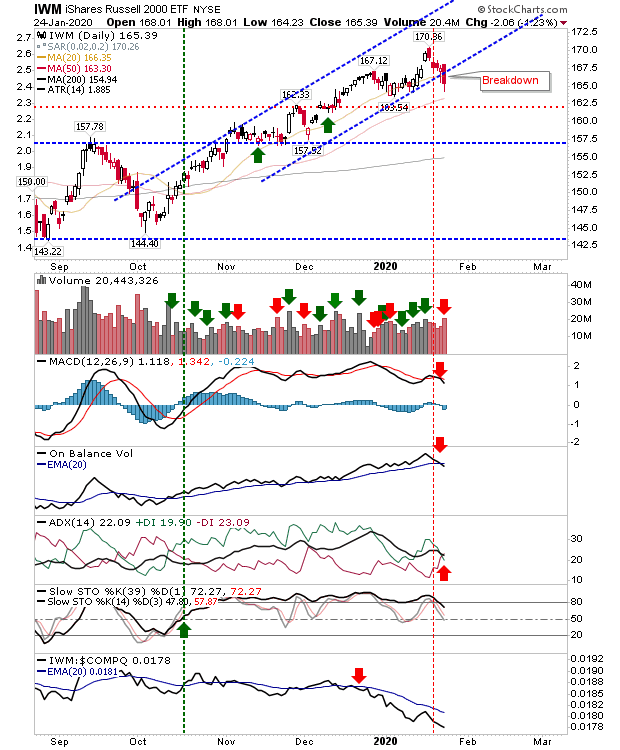
Not since September of last year have we seen a selling day like Friday's. Hardest hit of the indices was the Russell 2000 (via iShares Russell 2000 ETF (NYSE:IWM)) as it broke below support of its rising channel. It remains above breakout support of $158, but with new 'sell' triggers for the MACD, On-Balance-Volume and ADX.
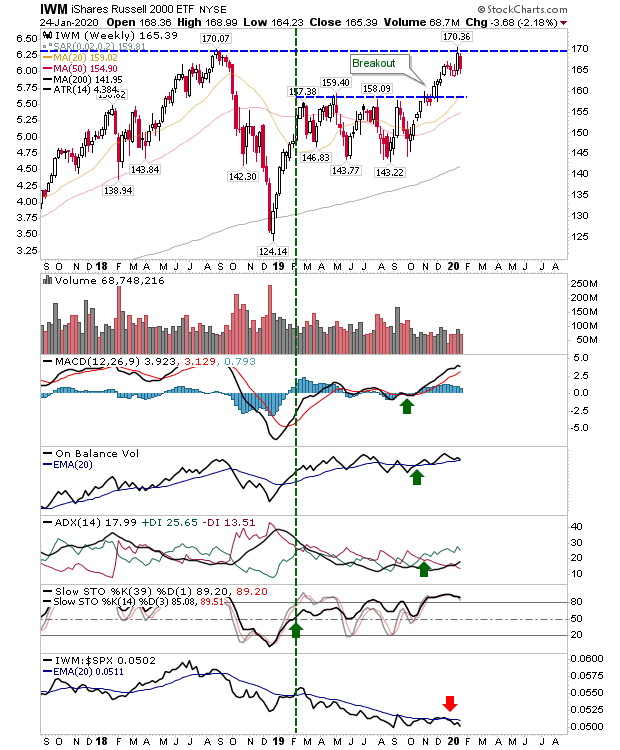
Relative performance versus the NASDAQ has been in freefall since mid-December and Friday's action didn't help. However, the weekly chart is the one to watch if you are holding long, and with 20- and 50-week MAs running closely aligned there is support to work with.
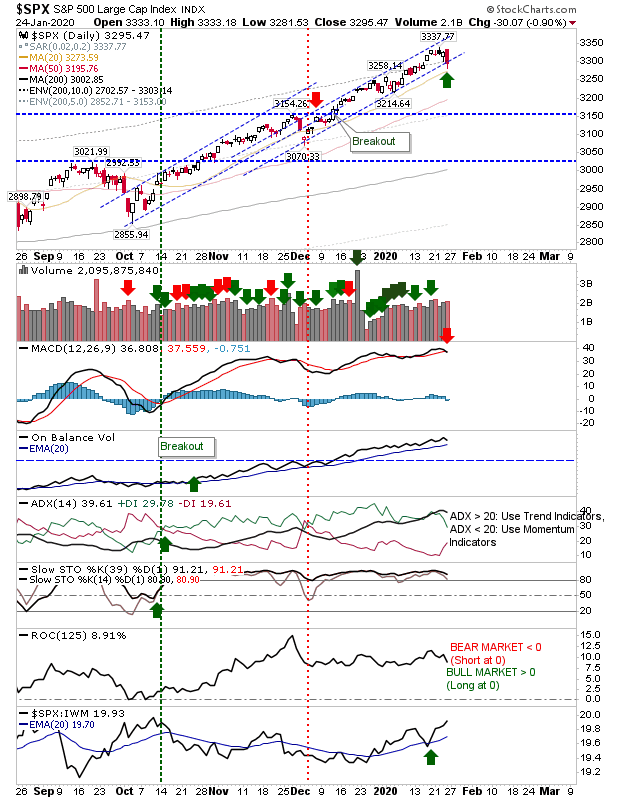
Losses for the S&P 500 weren't enough to break channel support, although the week did finish with a MACD trigger 'sell.' The index is outperforming the more speculative Russell 2000 and as long as this continues it will be the first port of call for money flowing into the market. Given the proximity of the 20-day MA it may be concluded that Friday's selling is a buying opportunity.
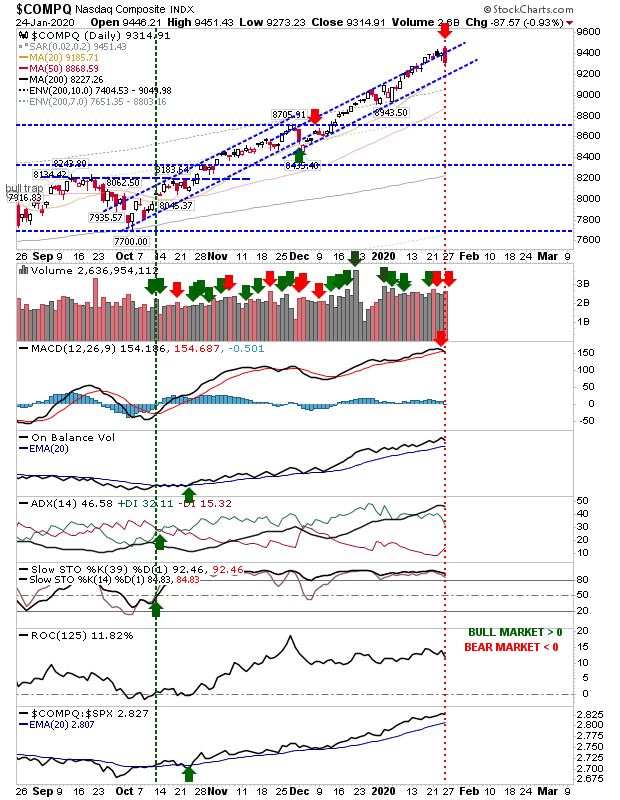
If your outlook is more in favor of bears, then the NASDAQ might prove to be better trade. The index had been riding around channel resistance—but Friday's selling has dumped it firmly back inside this channel. As for other indices, there was a MACD 'sell' to add to selling pressure, although relative performance was little impacted.
The Semiconductor Index began Friday trading above channel support before closing inside the channel. Unlike other indices, it holds a net bullish technical picture.
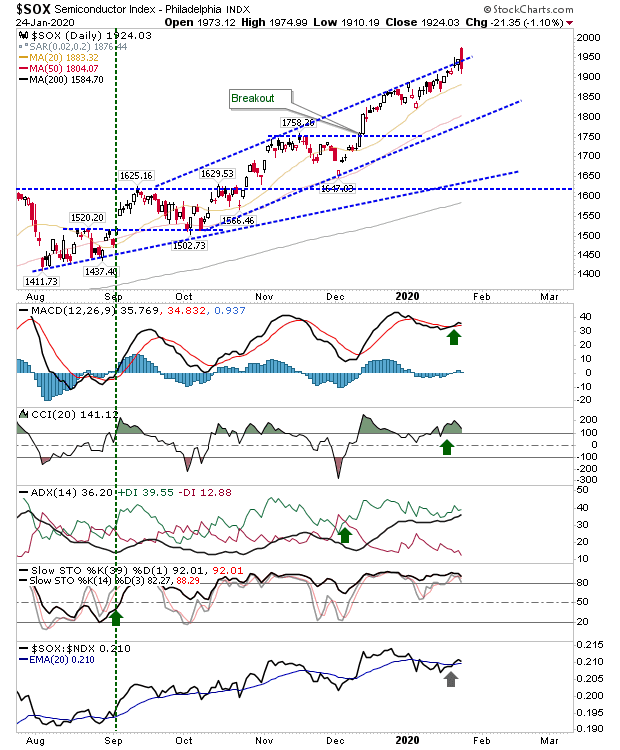
For today, it's a choice for shorts of working with the NASDAQ. Longs can try the S&P, but I suspect this downleg has more to run before buyers step in with any level of conviction. You can find some breadth charts here.
