Small Caps, Semiconductors Still In Shorting Territory

Published 12/12/2017, 12:20 AM
Updated 07/09/2023, 06:31 AM
US500
-
US2000
-
IXIC
-
SOX
-

While it was good day yesterday for Tech and Large Cap Indices it was a more muddled day for the Russell 2000 and Semiconductor Index.

The Russell 2000 wasn't able to enjoy the fruits of what was low key buying experienced in other indices. A second doji in a row gives shorts something to work with as the 'Bull Trap' continues to influence buyers' behavior.
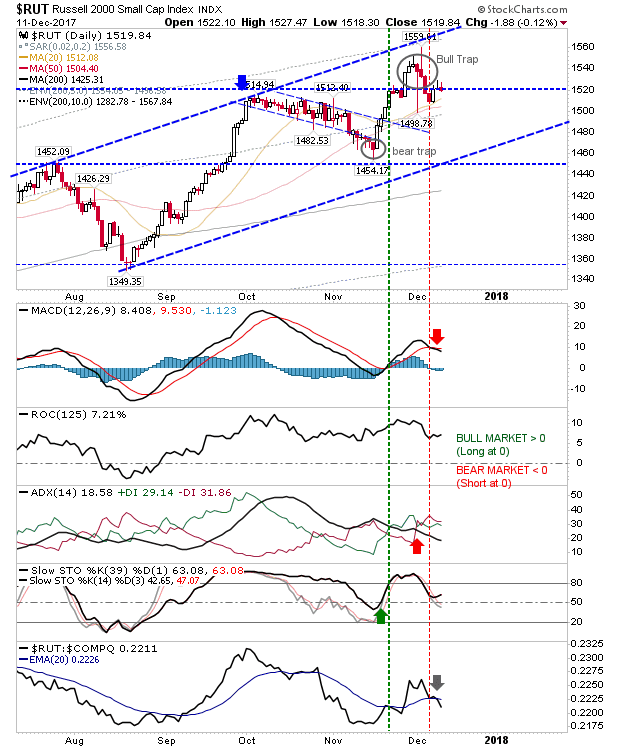
RUT Daily Chart


The Semiconductor Index was able to post similar gains as other lead indices but hasn't yet done enough to challenge its 50-day MA. However, it's a good shorting rally which can be attacked unless the 50-day MA is breached decisively.
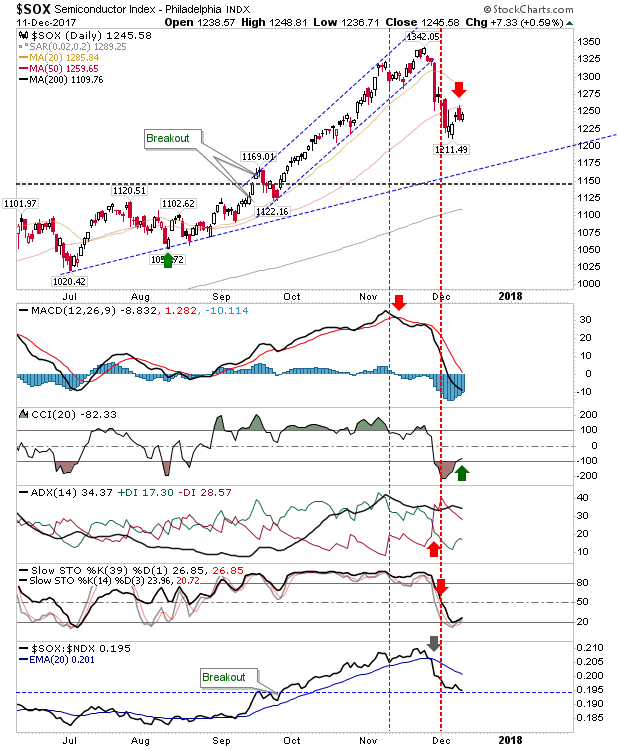
SOX Daily Chart


The S&P managed to post new all-time closing high on low volume. It sets up for a move to channel resistance. Existing longs have little reason to sell and shorts require something to attack, so look for more upside to follow. Technicals are back net bullish.
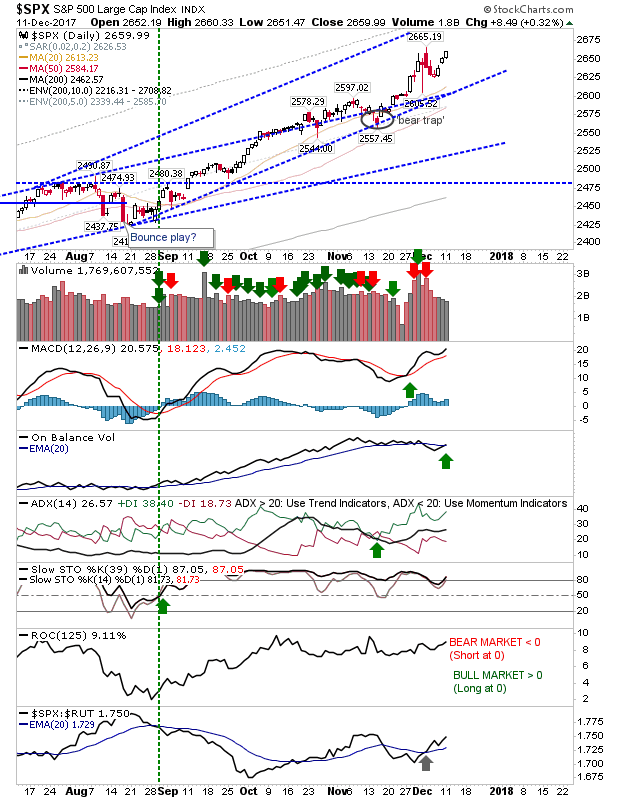
SPX Daily Chart


The NASDAQ managed to reverse the bearish black candlestick from Friday, reason enough to push any shorts entering yesterday out of their position.
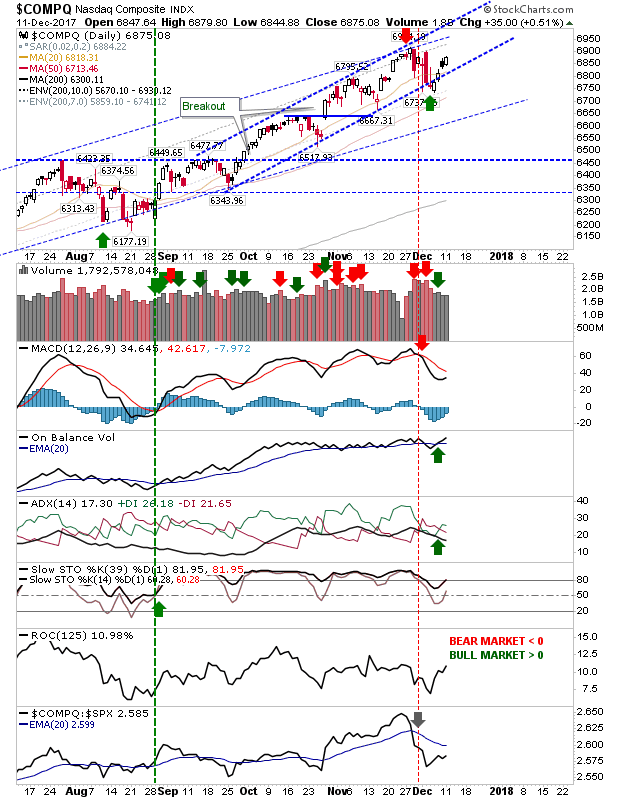
COMPQ Daily Chart


For today, Tuesday, shorts should keep focus on the Semiconductor Index and may be able to find joy in the Russell 2000 using a relatively tight stop. Longs could look to the NASDAQ and S&P to continue their runs to channel resistance.

Latest comments

Loading next article…
Risk Disclosure: Trading in financial instruments and/or cryptocurrencies involves high risks including the risk of losing some, or all, of your investment amount, and may not be suitable for all investors. Prices of cryptocurrencies are extremely volatile and may be affected by external factors such as financial, regulatory or political events. Trading on margin increases the financial risks.
Before deciding to trade in financial instrument or cryptocurrencies you should be fully informed of the risks and costs associated with trading the financial markets, carefully consider your investment objectives, level of experience, and risk appetite, and seek professional advice where needed.
Fusion Media would like to remind you that the data contained in this website is not necessarily real-time nor accurate. The data and prices on the website are not necessarily provided by any market or exchange, but may be provided by market makers, and so prices may not be accurate and may differ from the actual price at any given market, meaning prices are indicative and not appropriate for trading purposes. Fusion Media and any provider of the data contained in this website will not accept liability for any loss or damage as a result of your trading, or your reliance on the information contained within this website.
It is prohibited to use, store, reproduce, display, modify, transmit or distribute the data contained in this website without the explicit prior written permission of Fusion Media and/or the data provider. All intellectual property rights are reserved by the providers and/or the exchange providing the data contained in this website.
Fusion Media may be compensated by the advertisers that appear on the website, based on your interaction with the advertisements or advertisers.
© 2007-2025 - Fusion Media Limited. All Rights Reserved.