Semiconductors Kick In As Bounce Reaches Extremes

Published 02/07/2019, 12:10 AM
Updated 07/09/2023, 06:31 AM
US500
-
US2000
-
IXIC
-
SOX
-

This bounce which kicked off in December has reached levels which are getting rich for many but not for the Semiconductor Index.

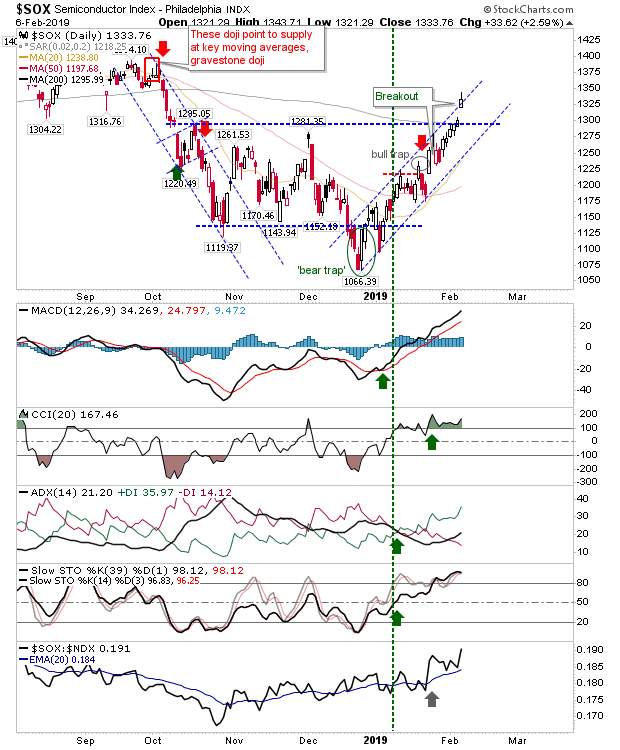
The Semiconductor Index gapped higher which keeps it hugging the channel resistance line but also offers a buffer down to support; yesterday's action registered as a breakout. Technicals are in good shape and relative performance is good.

SOX Daily Chart

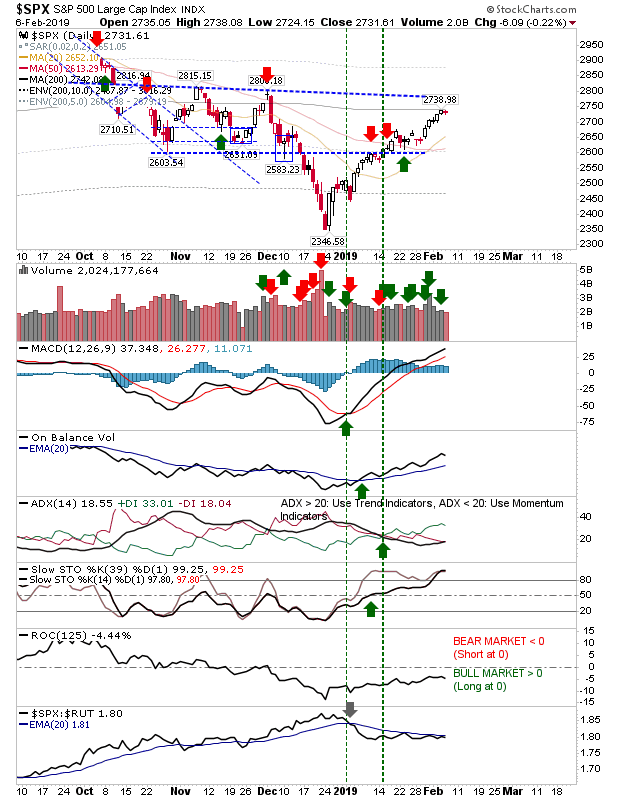
The S&P closed with a narrow doji just below its 200-day MA. The 200-day MA is looking a little obvious as resistance so watch for a gap higher to catch shorts out, before a reversal return below the 200-day MA. Relative performance is picking up against Small Caps which will help, but in itself is bearish for the rally as money cycles into more defensive Large Cap stocks.
SPX Daily Chart

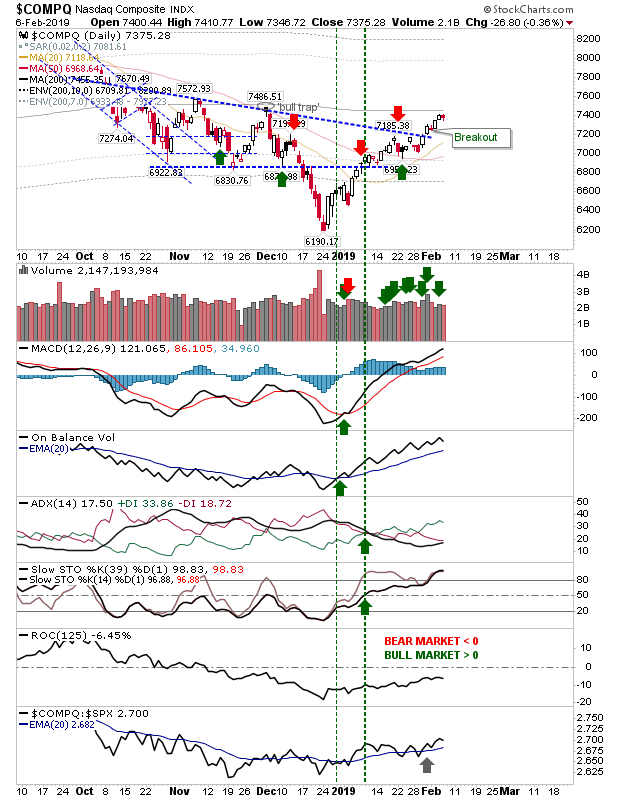
The NASDAQ is flying a little below the radar. It has broken declining resistance but still has the 200-day MA to navigate. Technicals are in good shape and the accumulation trend in on-balance-volume is strong. Yesterday's move in the Semiconductor Index should help push the index above its 200-day MA.
COMPQ Daily Chart

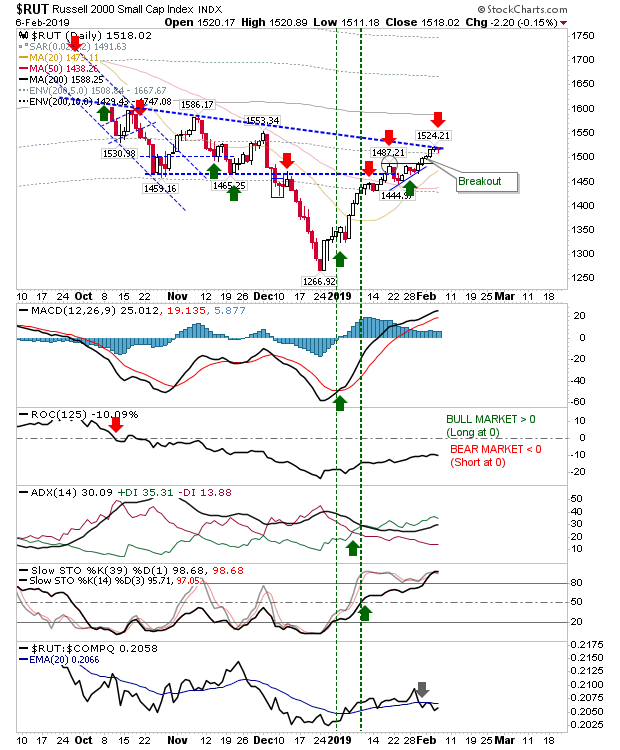
The Russell 2000 sits at an interesting juncture of declining resistance. It's not near the 200-day MA, so the only natural resistance to consider is declining resistance. Relative performance is ticking down, making it an index struggling to attract the attention of traders and investors. I would be looking for sellers/shorts to get aggressive here.
RUT Daily Chart

For today, shorts can look to trade the Russell 2000 with stops not far above 1,524. Should the rally continue then the S&P may instead offer the better short play—but only if there is a gap down Friday. There isn't a whole lot for longs; some may look to buy the break in the Semiconductor Index, but only if there is a positive test of breakout support.

Latest comments

Loading next article…
Risk Disclosure: Trading in financial instruments and/or cryptocurrencies involves high risks including the risk of losing some, or all, of your investment amount, and may not be suitable for all investors. Prices of cryptocurrencies are extremely volatile and may be affected by external factors such as financial, regulatory or political events. Trading on margin increases the financial risks.
Before deciding to trade in financial instrument or cryptocurrencies you should be fully informed of the risks and costs associated with trading the financial markets, carefully consider your investment objectives, level of experience, and risk appetite, and seek professional advice where needed.
Fusion Media would like to remind you that the data contained in this website is not necessarily real-time nor accurate. The data and prices on the website are not necessarily provided by any market or exchange, but may be provided by market makers, and so prices may not be accurate and may differ from the actual price at any given market, meaning prices are indicative and not appropriate for trading purposes. Fusion Media and any provider of the data contained in this website will not accept liability for any loss or damage as a result of your trading, or your reliance on the information contained within this website.
It is prohibited to use, store, reproduce, display, modify, transmit or distribute the data contained in this website without the explicit prior written permission of Fusion Media and/or the data provider. All intellectual property rights are reserved by the providers and/or the exchange providing the data contained in this website.
Fusion Media may be compensated by the advertisers that appear on the website, based on your interaction with the advertisements or advertisers.
© 2007-2025 - Fusion Media Limited. All Rights Reserved.