Semiconductors Gap Higher; Russell 2000 Leads Lower

Published 04/18/2019, 12:19 AM
Updated 07/09/2023, 06:31 AM
US500
-
US2000
-
IXIC
-
SOX
-

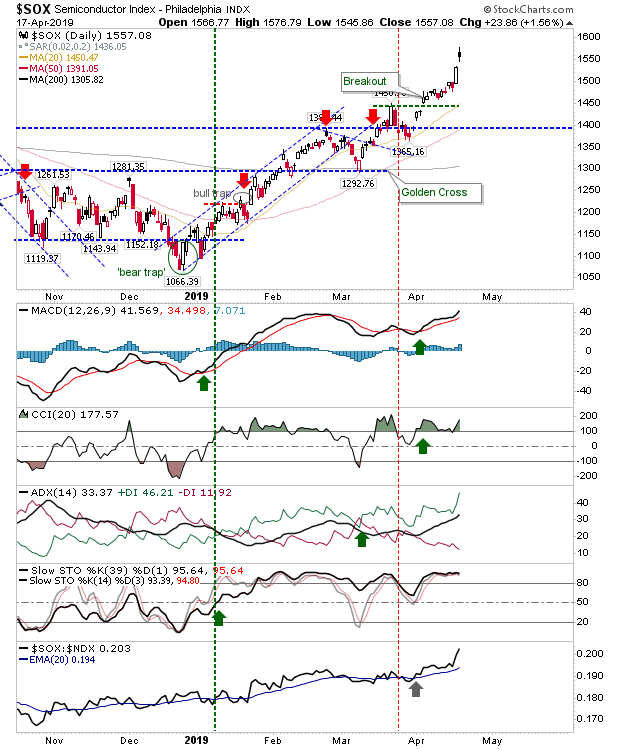
A mixed day for markets yesterday. The only winner was the Semiconductor Index. It gapped higher off Tuesday's strong white candle. With other markets suffering losses, the risk of a 'bearish shooting star' tday is reasonably high.

SOX Daily Chart

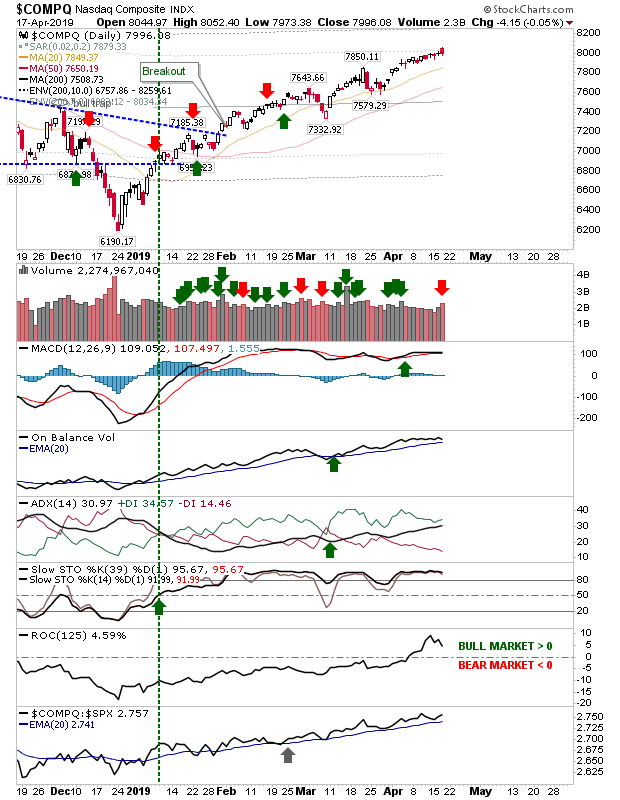
The NASDAQ ran contrary to the Semiconductor Index as it finished on a small bearish engulfing pattern. I would have looked for the Semiconductor Index to feed into the NASDAQ but this hasn't happened; it's hard to see the Semiconductor Index maintaining this form.
COMPQ Daily Chart


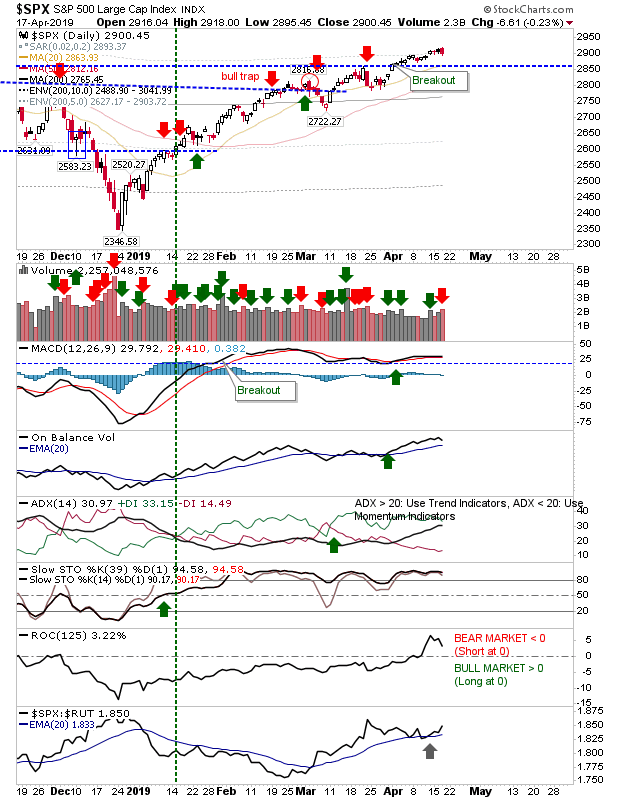
The S&P had a similar day to the NASDAQ, finishing with a bearish engulfing pattern. As with the NASDAQ, volume rose in confirmed distribution. On the bright side, relative performance picked up against the Russell 2000; so whatever money is coming into the market will flow into Large Caps first.
SPX Daily Chart

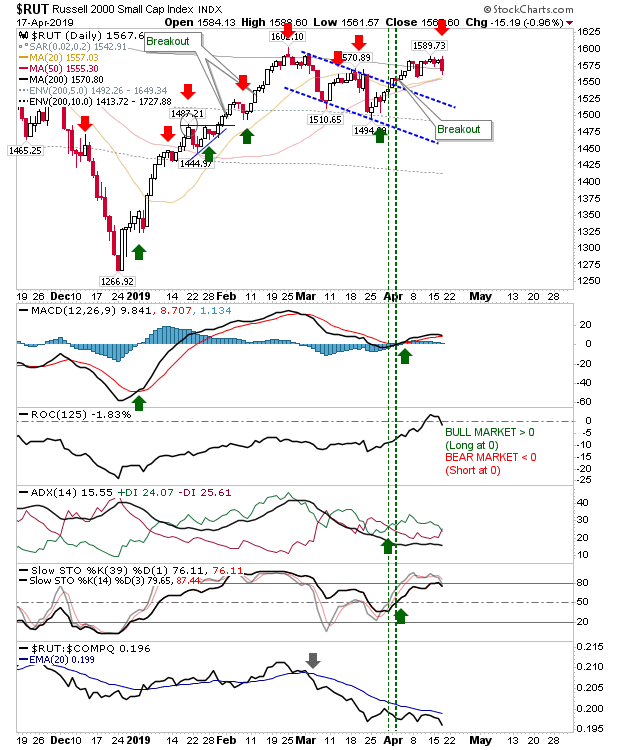
The Russell 2000 experienced a near 1% loss on another bearish engulfing pattern. Today will see the first test of support of converged 20-day and 50-day MAs; I have marked this as a possible shorting opportunity with a bearish divergence in the MACD and a sharp drop in relative performance.
RUT Daily Chart

For today, look to the Russell 2000 to add to yesterday's losses. At the same time, watch for a gap down (and bearish evening star) in the Semiconductor Index.

Latest comments

Loading next article…
Risk Disclosure: Trading in financial instruments and/or cryptocurrencies involves high risks including the risk of losing some, or all, of your investment amount, and may not be suitable for all investors. Prices of cryptocurrencies are extremely volatile and may be affected by external factors such as financial, regulatory or political events. Trading on margin increases the financial risks.
Before deciding to trade in financial instrument or cryptocurrencies you should be fully informed of the risks and costs associated with trading the financial markets, carefully consider your investment objectives, level of experience, and risk appetite, and seek professional advice where needed.
Fusion Media would like to remind you that the data contained in this website is not necessarily real-time nor accurate. The data and prices on the website are not necessarily provided by any market or exchange, but may be provided by market makers, and so prices may not be accurate and may differ from the actual price at any given market, meaning prices are indicative and not appropriate for trading purposes. Fusion Media and any provider of the data contained in this website will not accept liability for any loss or damage as a result of your trading, or your reliance on the information contained within this website.
It is prohibited to use, store, reproduce, display, modify, transmit or distribute the data contained in this website without the explicit prior written permission of Fusion Media and/or the data provider. All intellectual property rights are reserved by the providers and/or the exchange providing the data contained in this website.
Fusion Media may be compensated by the advertisers that appear on the website, based on your interaction with the advertisements or advertisers.
© 2007-2025 - Fusion Media Limited. All Rights Reserved.