Selling Pummels Markets

Published 08/24/2015, 11:53 PM
US500
-
US2000
-
IXIC
-
SOX
-
VXN
-

The third day of selling pushed markets deeper into oversold territory and potential long term 'buy' territory. In my 'bottom' tracker, the S&P 500 is priced in the 90% zone (i.e. only 10% of historic prices relative to the 200-day MA have been worse), while the NASDAQ Composite and Russell 2000 is in the 85% zone. It has been 4 years since markets have been this oversold.

The S&P made a picture perfect tag of the 10%, 200-day Envelope. Although with trading restrictions in place at market open it would have been difficult to get a fill at this price. But now is a time to be shopping for value in individual stocks
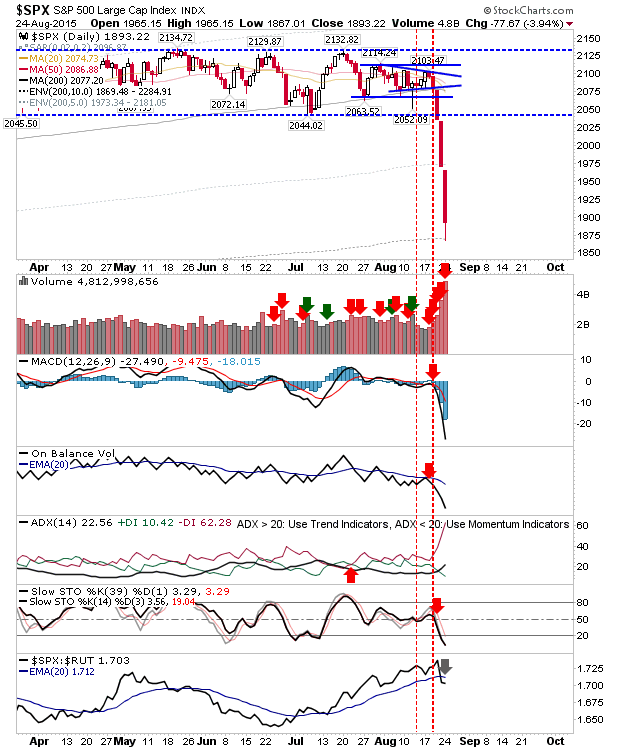
S&P Daily Chart
The Nasdaq closed the breakdown gap in intraday trading, but the weaker finish left this in neutral territory.
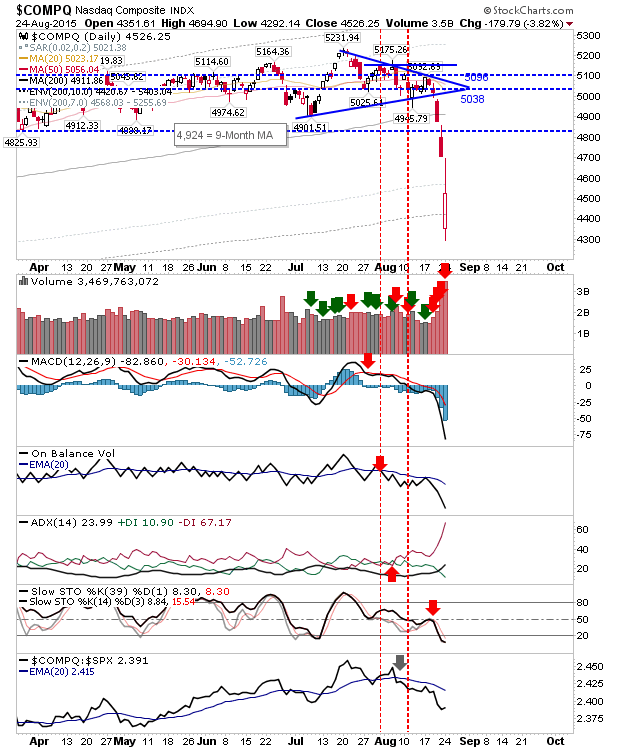
COMPQ Daily Chart
The Russell 2000 came close to a tag of the 10% 200-day MA envelope. It too looks to be offering value for those willing to take the risk.
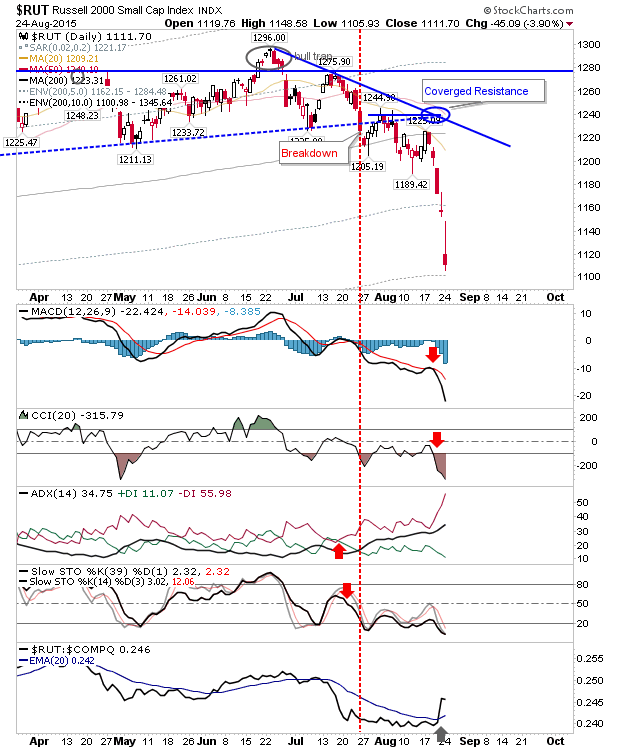
Russell 2000 Daily Chart
The carnage continued elsewhere. The Philadelphia Semiconductor Index experienced a wide range day, but didn't lose as much ground as lead indices. Has a trade worthy bottom arrived?
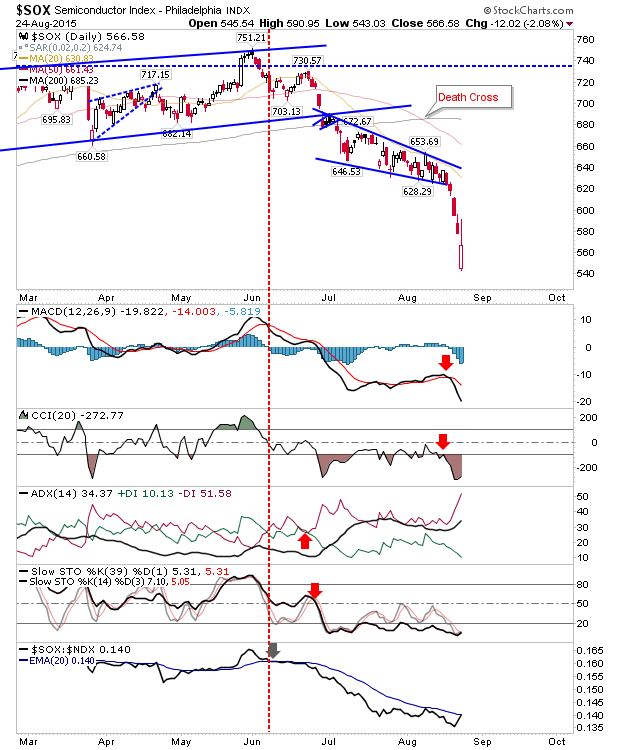
Semiconductor Index Daily Chart
Or will the CBOE NASDAQ 100 Volatility push another weak month for September.
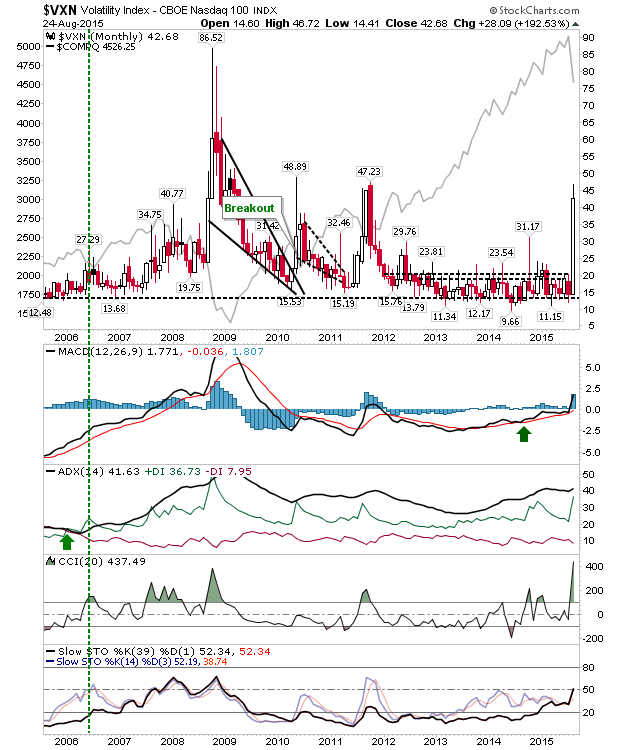
VXN Daily Chart
Short term traders will likely continue to have it rough, but long term buyers may find some valuables amongst the rubble.

Latest comments

Loading next article…
Risk Disclosure: Trading in financial instruments and/or cryptocurrencies involves high risks including the risk of losing some, or all, of your investment amount, and may not be suitable for all investors. Prices of cryptocurrencies are extremely volatile and may be affected by external factors such as financial, regulatory or political events. Trading on margin increases the financial risks.
Before deciding to trade in financial instrument or cryptocurrencies you should be fully informed of the risks and costs associated with trading the financial markets, carefully consider your investment objectives, level of experience, and risk appetite, and seek professional advice where needed.
Fusion Media would like to remind you that the data contained in this website is not necessarily real-time nor accurate. The data and prices on the website are not necessarily provided by any market or exchange, but may be provided by market makers, and so prices may not be accurate and may differ from the actual price at any given market, meaning prices are indicative and not appropriate for trading purposes. Fusion Media and any provider of the data contained in this website will not accept liability for any loss or damage as a result of your trading, or your reliance on the information contained within this website.
It is prohibited to use, store, reproduce, display, modify, transmit or distribute the data contained in this website without the explicit prior written permission of Fusion Media and/or the data provider. All intellectual property rights are reserved by the providers and/or the exchange providing the data contained in this website.
Fusion Media may be compensated by the advertisers that appear on the website, based on your interaction with the advertisements or advertisers.
© 2007-2025 - Fusion Media Limited. All Rights Reserved.