Scary Charts For Any Remaining Bears

Published 02/18/2015, 12:46 AM
Updated 07/09/2023, 06:31 AM
NDX
-
US500
-
DJI
-
US2000
-
XOI
-
OEX
-

February has been a wretched month for the bears (dare I use the plural anymore?). Let’s review where things stand as of Tuesday’s close. We’ve got a NASDAQ Composite which has broken out of a cleanly-defined range:
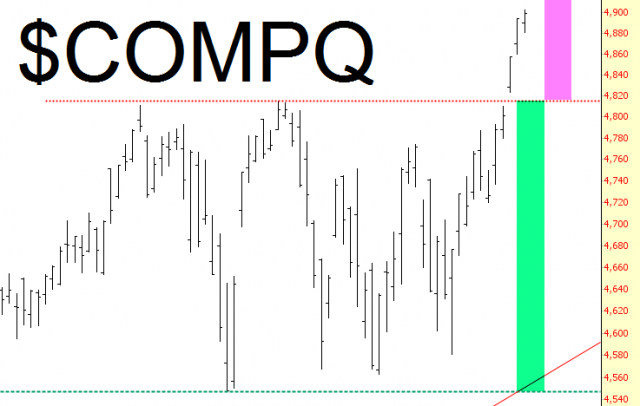
COMPQ Chart

A Dow which is a fraction of a percent away from another lifetime high:
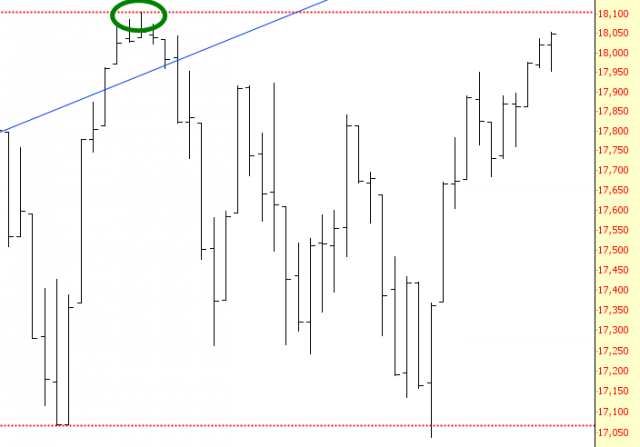
DOW Chart

An S&P 100 which pushed to a lifetime high and has likewise escaped its own range:
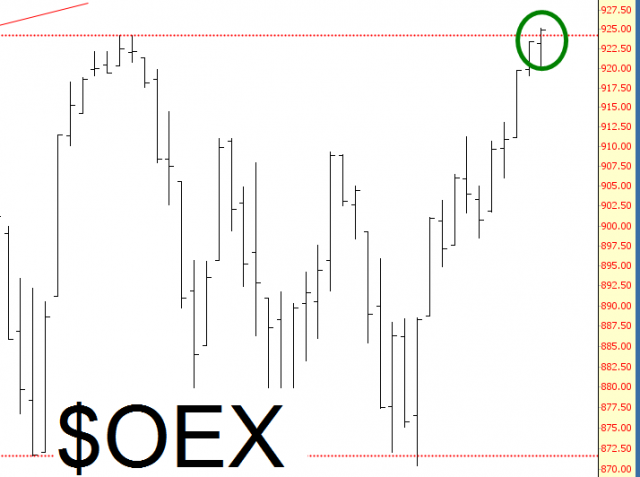
OEX (S&P 100) Chart

A Russell 2000 which has, as so many other indexes, painted another lifetime high as well as emerged above a fairly clean “bottoming” (ha!) pattern:
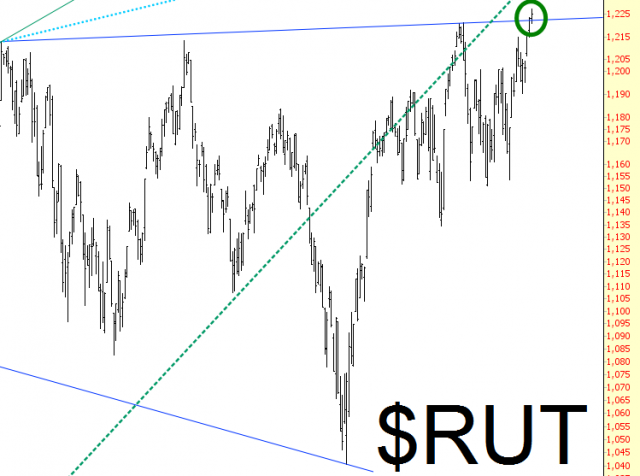
RUT Chart

And an S&P 500 which just so happened to close at 2100 today, aided by a sudden crush of buy orders at the day’s end to create that very headline-friendly round number.
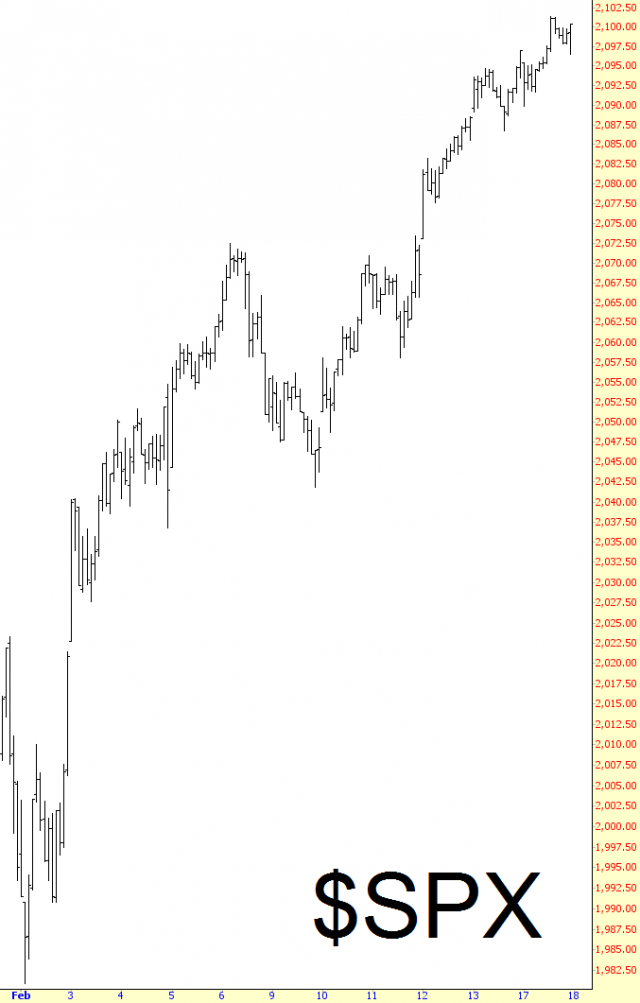
SPX Chart

Pretty much the last index that hasn’t been bull-wrecked is the Dow Jones Composite, which is a hair’s breadth away from emerging from its own diamond pattern, although it has not done so yet:
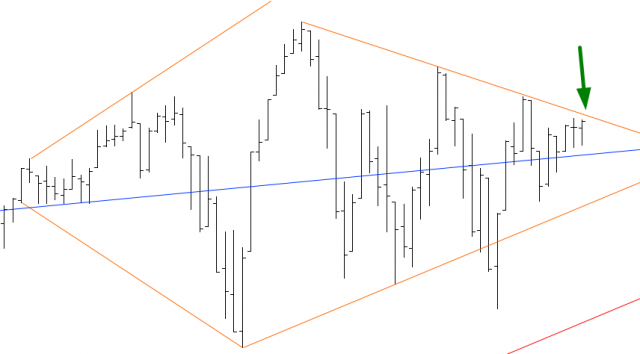
Dow Jones Composite Chart

My main focused continues to be energies (I don’t have a single domestic ETF of any kind). The Oil and Gas index is getting deliciously close to closing its own important gap. The close it gets to doing so, the more interesting the opportunities are:
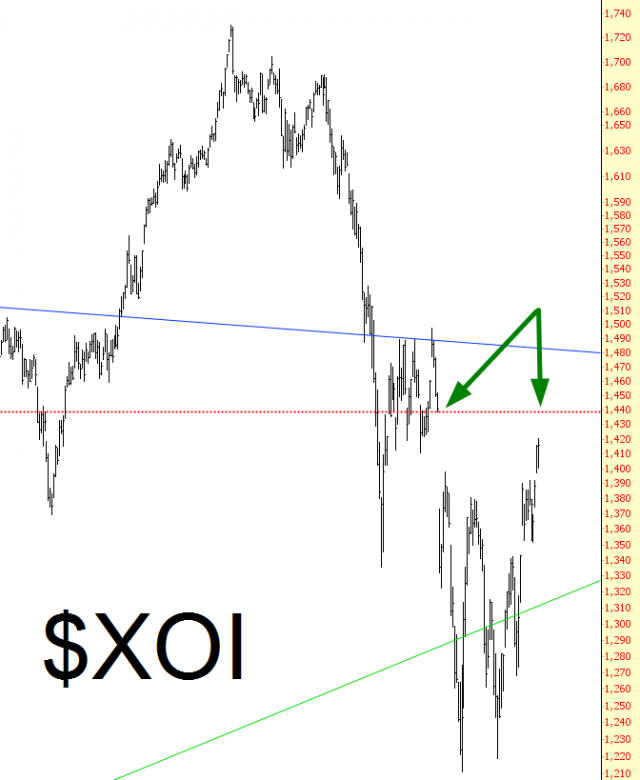
XOI Chart

That’s it from me, the last bear standing!

Latest comments

Loading next article…
Risk Disclosure: Trading in financial instruments and/or cryptocurrencies involves high risks including the risk of losing some, or all, of your investment amount, and may not be suitable for all investors. Prices of cryptocurrencies are extremely volatile and may be affected by external factors such as financial, regulatory or political events. Trading on margin increases the financial risks.
Before deciding to trade in financial instrument or cryptocurrencies you should be fully informed of the risks and costs associated with trading the financial markets, carefully consider your investment objectives, level of experience, and risk appetite, and seek professional advice where needed.
Fusion Media would like to remind you that the data contained in this website is not necessarily real-time nor accurate. The data and prices on the website are not necessarily provided by any market or exchange, but may be provided by market makers, and so prices may not be accurate and may differ from the actual price at any given market, meaning prices are indicative and not appropriate for trading purposes. Fusion Media and any provider of the data contained in this website will not accept liability for any loss or damage as a result of your trading, or your reliance on the information contained within this website.
It is prohibited to use, store, reproduce, display, modify, transmit or distribute the data contained in this website without the explicit prior written permission of Fusion Media and/or the data provider. All intellectual property rights are reserved by the providers and/or the exchange providing the data contained in this website.
Fusion Media may be compensated by the advertisers that appear on the website, based on your interaction with the advertisements or advertisers.
© 2007-2025 - Fusion Media Limited. All Rights Reserved.