The market didn’t waste any time “getting on with it” yesterday after the bearish action on the day of the Fed announcement. It fell, and hard. We are going to look at this carefully because what appears to be starting is a devastating “end run around the line” smash – if so a brutal plunge is just around the corner.
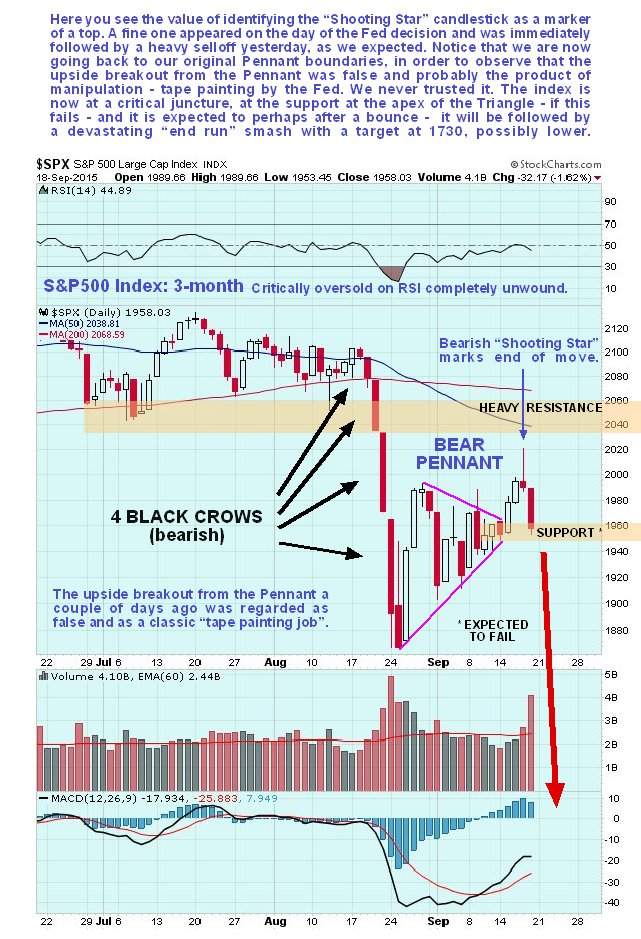
A few days back we were a little too accommodating in adjusting the upper boundary of the Pennant shown on the 3-month chart below when the index pushed out of the top of it. We shouldn’t have and on this chart we are going back to our original Pennant boundaries, which is important as it enables us to define where the support is at the apex of the Pennant. As you will recall the upside breakout from the Pennant, on the basis of its original boundaries, was regarded with deep suspicion, and it appears to have been the product of manipulation – Fed buying to “paint the tape”, especially as there was no such breakout in other markets like the London FTSE 100 and Tokyo Nikkei 225, where a parallel Pennant had formed. If so then they may soon end up with egg on their faces.

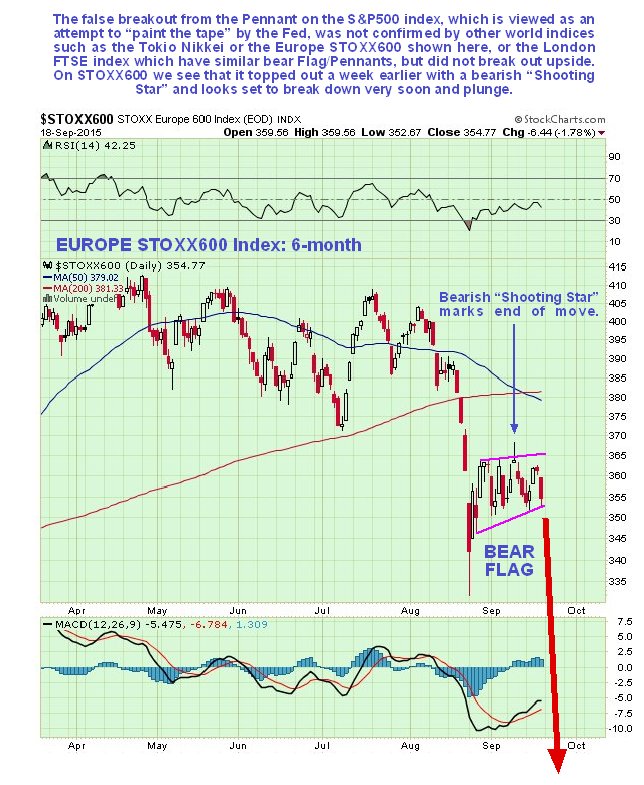
Other world market indices such as the Europe EURO STOXX 600 shown here, and the London FTSE and the Tokio Nikkei, which have similar bear Flags or Pennants completing, did not confirm the false upside breakout from the Pennant on the US S&P 500 index before the Fed announcement…
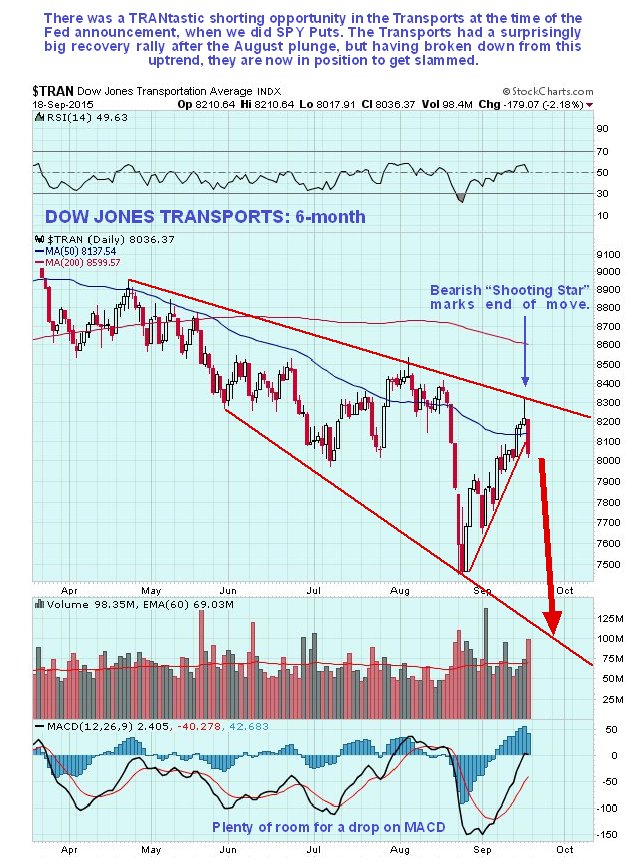
Meanwhile, the Dow Jones Transportation, which had a surprisingly big recovery rally after the August plunge, are perfectly positioned to drop away hard after failing at downtrend line resistance with a bearish “Shooting Star” and then breaking down from their recovery uptrend…
The market is at a critical juncture because yesterday it dropped to the support at the apex of the Pennant. If this fails – and it is expected to perhaps after a minor bounce – then we will quickly find ourselves in an “end run” smash situation, which is what happens when a Pennant or Triangle breakout fails in this manner. The market should drop away fast, perhaps like a rock, and the downside target for this move is 1730, which it could easily exceed. However, if it doesn’t slice through the support at the August lows in the 1870 area and sticks there we may ditch half of our Puts there for a good profit, and let the rest ride. We’ll see how it looks when it gets there. With respect to nailing the get out point for Puts, the Transports chart shown above is helpful as it gives us a potential downside target at the lower boundary of its expanding downtrend channel.


