Asian markets were mixed today, but the major European indexes posted strong gains, with the Euro Stoxx 50 surging 1.22%. US equity indexes followed the European model, especially the tech-laden NASDAQ, which rose 1.06%.
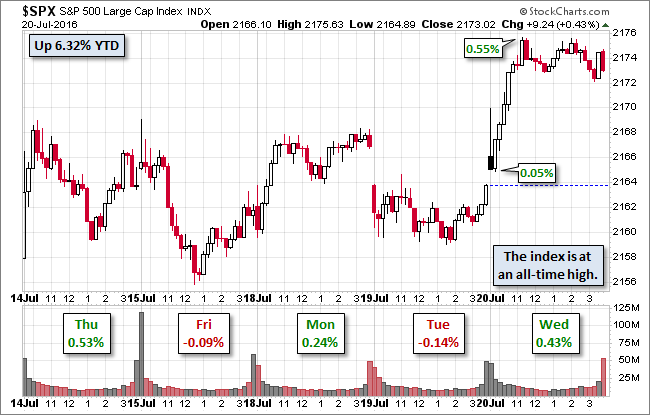
Our benchmark S&P 500 Rallied at the open and rose to its 0.55% intraday high by late morning. It then traded in a narrow range for the remainder of the day, closing with a trimmed gain of 0.43%, a new record close.
The yield on the 10-year note rose three basis points to close at 1.59%.
Here is a snapshot of past five sessions in the S&P 500.
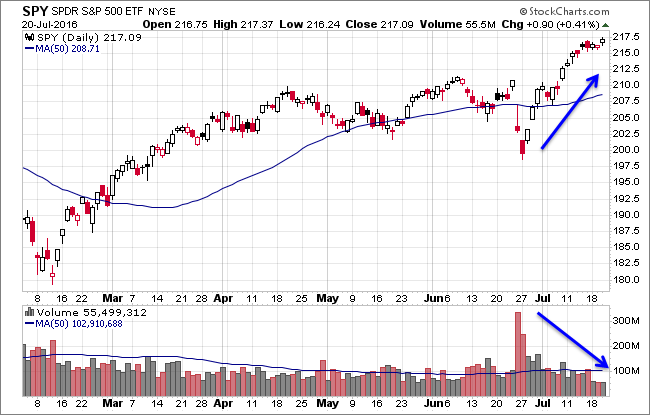
Here is a daily chart of the SPDR S&P 500 (NYSE:SPY) ETF, which gives a better sense of investor participation than the underlying index. As the rally since the June 27th low has advanced, trading volume has been declining.
A Perspective on Drawdowns
Here's a snapshot of selloffs since the 2009 trough.
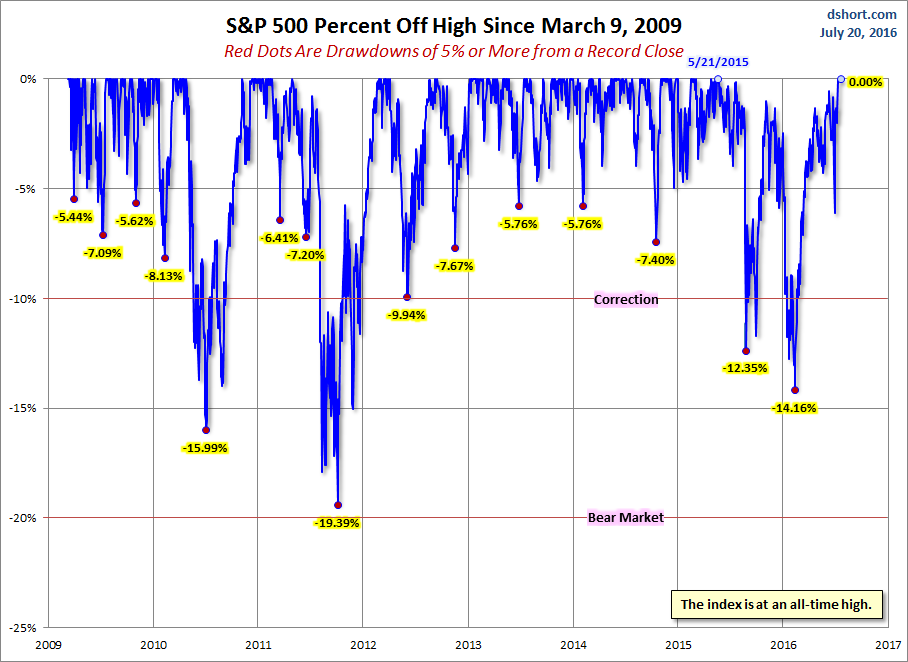
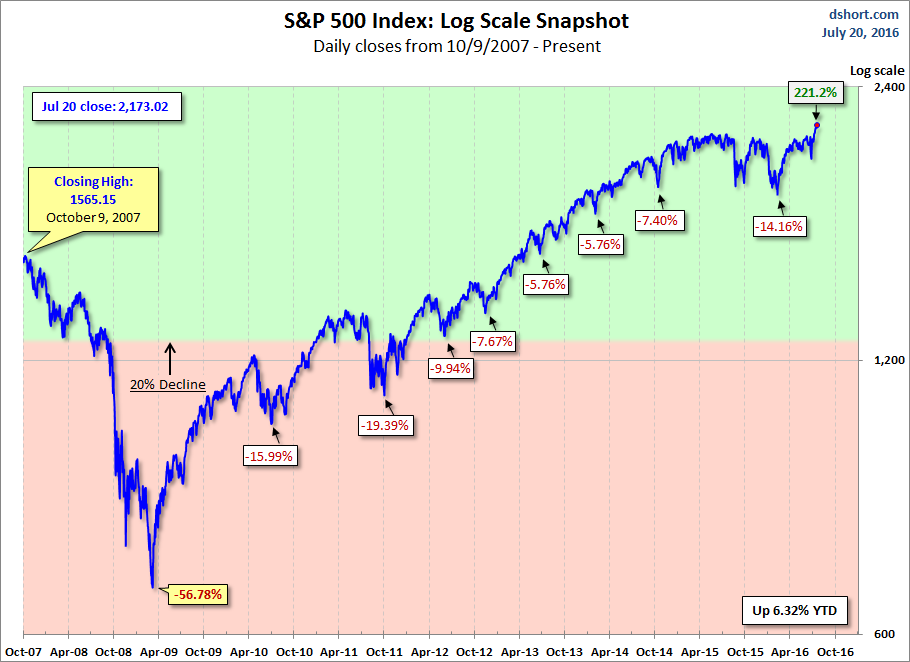
Here is a more conventional log-scale chart with drawdowns highlighted.
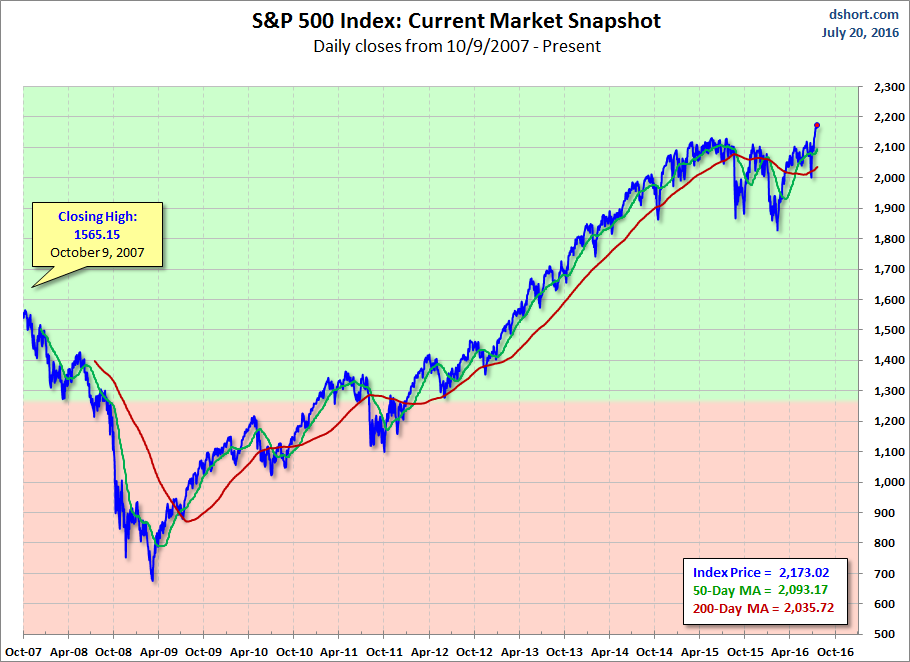
Here is a linear scale version of the same chart with the 50- and 200-day moving averages.
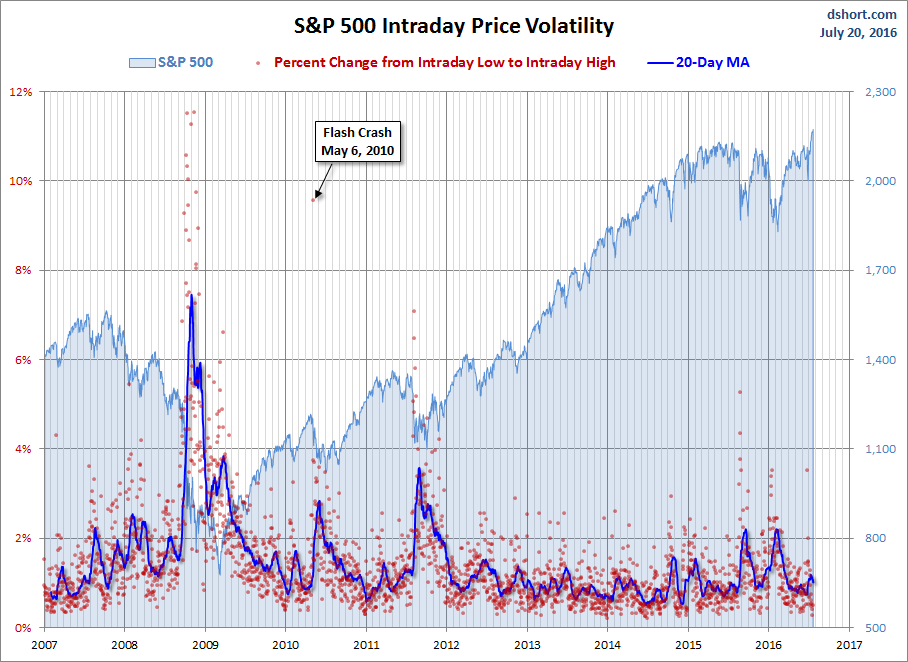
A Perspective on Volatility
For a sense of the correlation between the closing price and intraday volatility, the chart below overlays the S&P 500 since 2007 with the intraday price range. We've also included a 20-day moving average to help identify trends in volatility.
