Investing.com’s stocks of the week
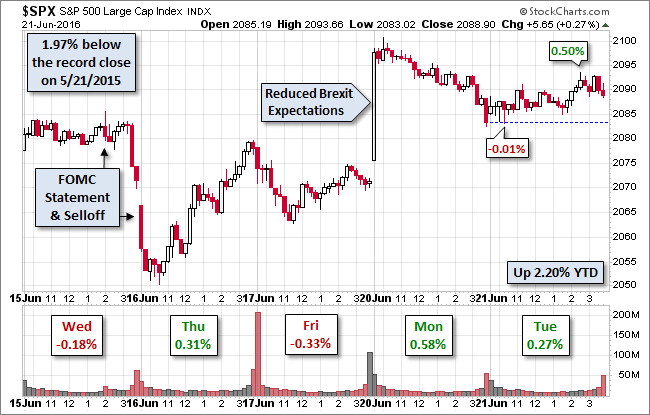
Global markets were mostly positive again today but at more modest levels. The Nikkei rose 1.28%, but that was over a percent lower than yesterday's gain. The Euro STOXX 50 gained 0.83%, well off the 3.29% surge yesterday on a general sense of reduced Brexit odds. Our benchmark S&P 500 traded in a narrow intraday 0.51% intraday range, which is at the 9th percentile of the 118 market days so far in 2016, ending with a modest 0.27% gain. Chair Yellen's congressional testimony had little if any impact on today's action since it varied little from the tone of her post-FOMC meeting press conference of last Wednesday.
The 10-year note closed at 1.71%, up four basis points from the previous session.
Here is a snapshot of past five sessions in the S&P 500.
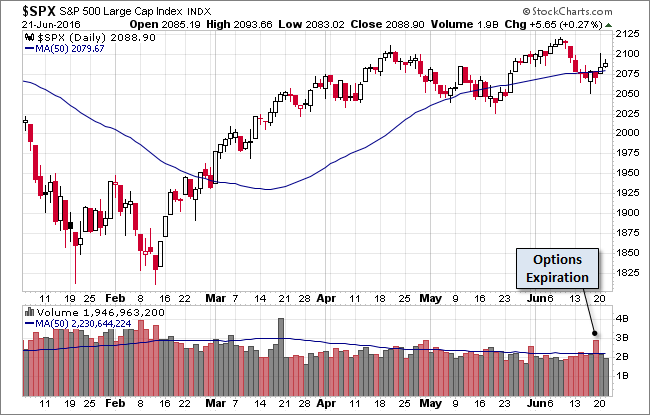
Here is a daily chart of the index. Trading volume on today's advance was on the light side.
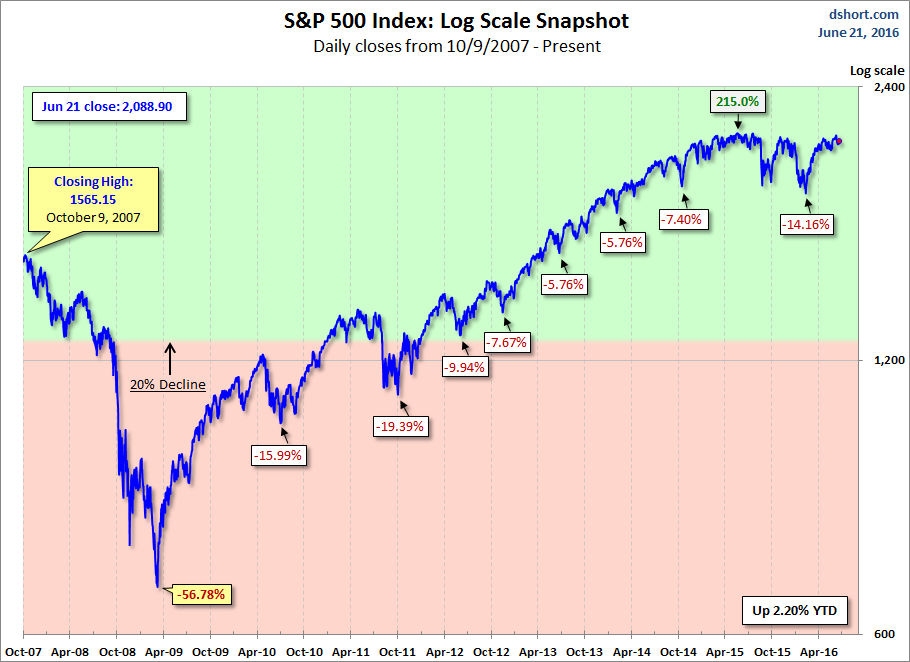
A Perspective on Drawdowns
Here's a snapshot of selloffs since the 2009 trough.
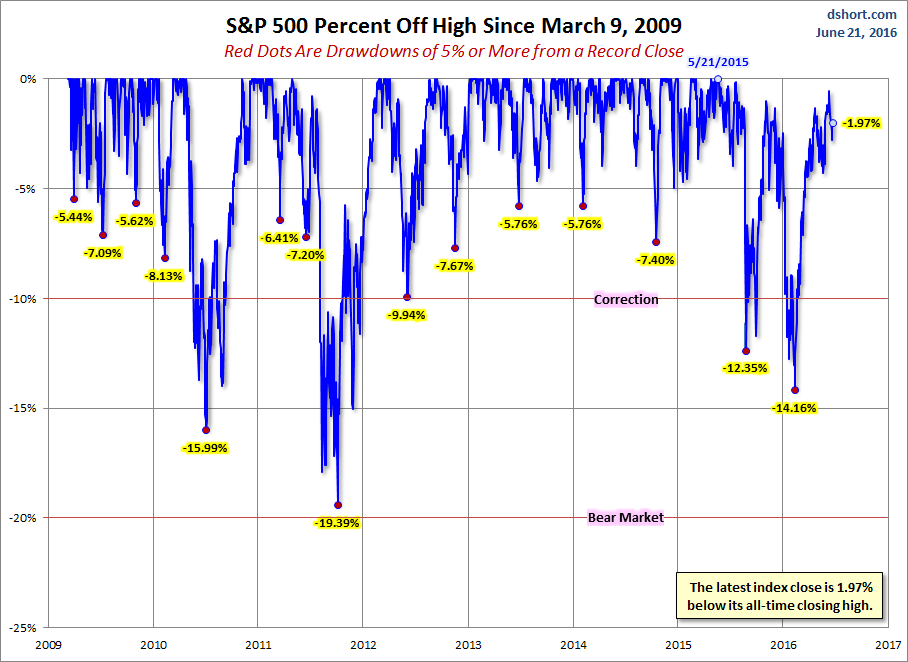
Here is a more conventional log-scale chart with drawdowns highlighted.
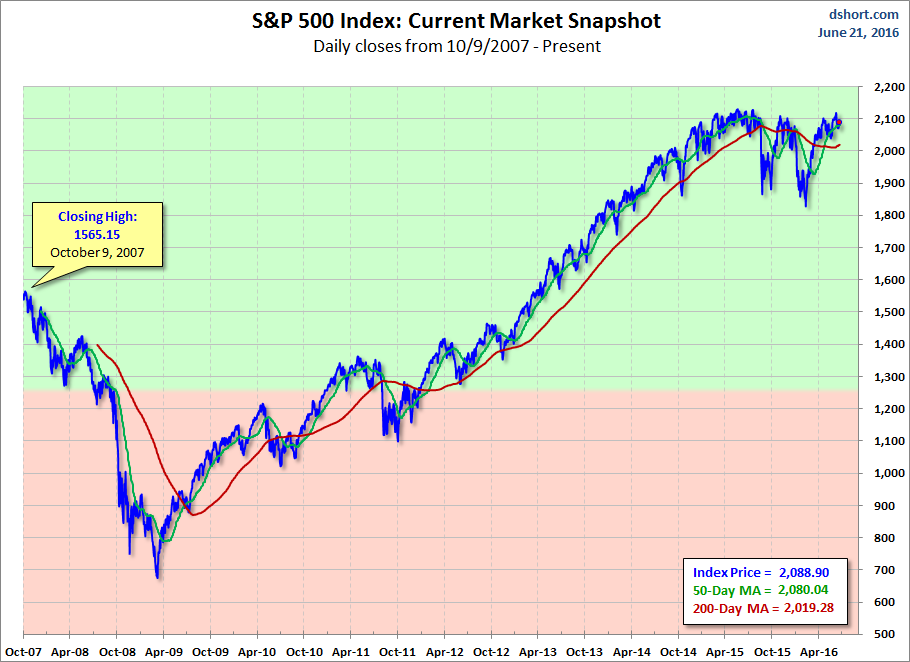
Here is a linear scale version of the same chart with the 50- and 200-day moving averages.
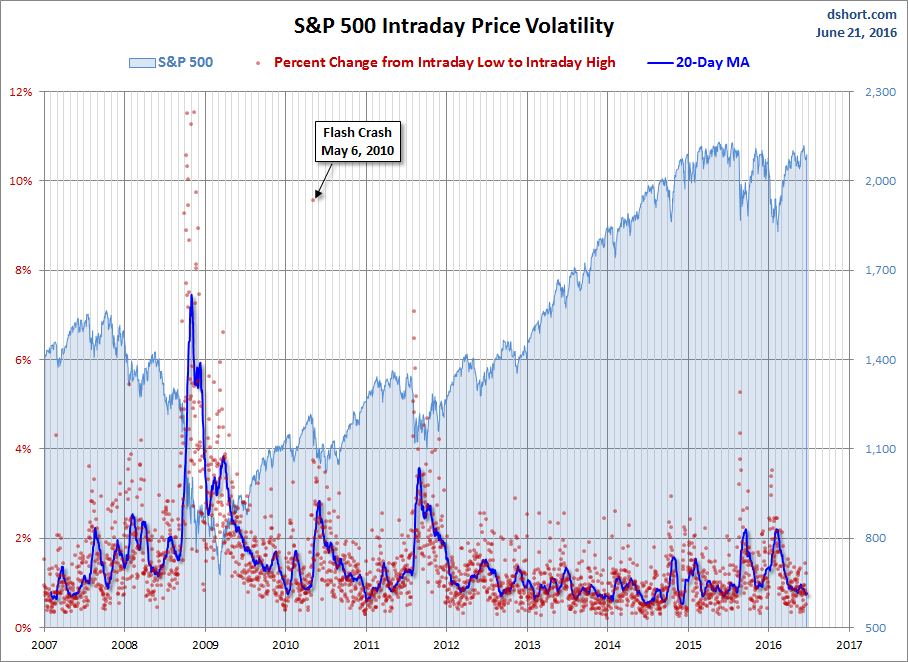
A Perspective on Volatility
For a sense of the correlation between the closing price and intraday volatility, the chart below overlays the S&P 500 since 2007 with the intraday price range. We've also included a 20-day moving average to help identify trends in volatility.
