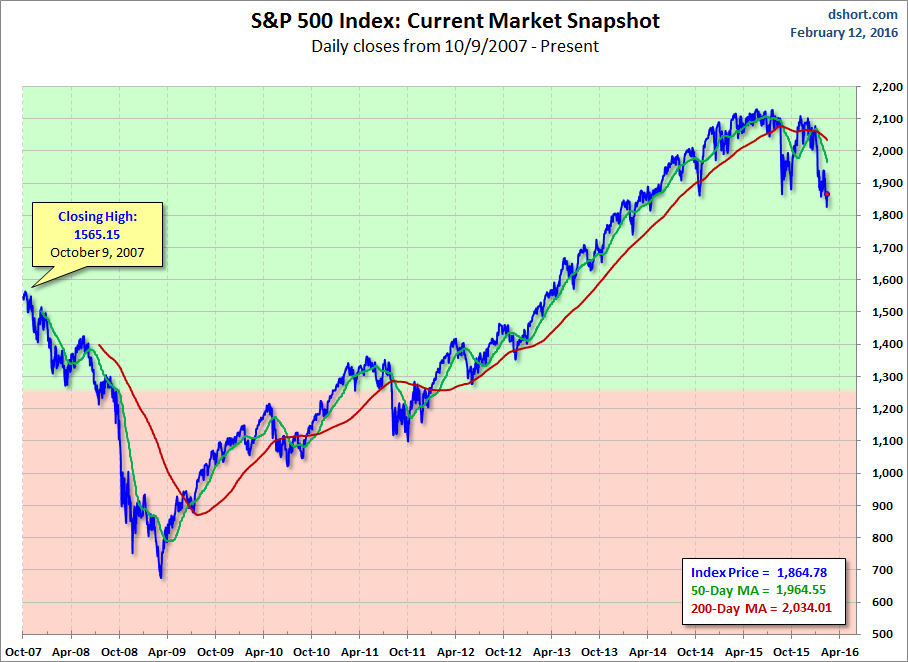
Before the US market opened, Japan's Nikkei took a post-holiday plunge of 4.84%. But European indexes were having a good day, with the Euro STOXX 50 subsequently closing with a 3.83% gain. A dramatic surge in oil appears to have triggered the reversal. WTI March Crude Futures have skyrocketed about 11%. The S&P 500 opened higher and rallied through the day to close at its intraday high with a 1.95% advance, snapping a five-day selloff. The question in everyone's mind: Will the recovery continue after the 3-day weekend?
The yield on the 10-year note closed at 1.74%, up 11 basis points from the previous close.
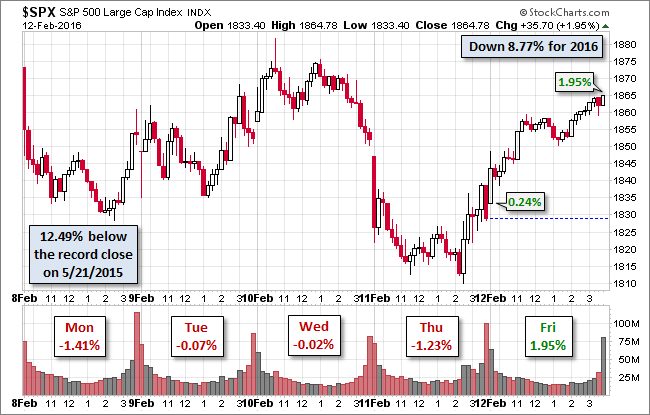
Here is a snapshot of past five sessions.
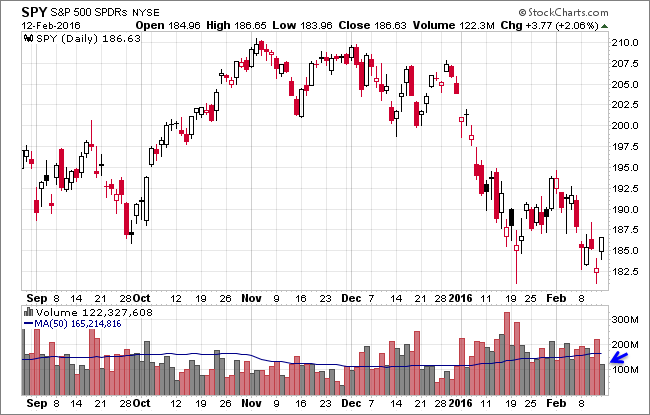
Here is a daily chart of the N:SPY ETF, which gives a better sense of investor participation in today's rally. Volume was quite light. Does that reflect a lack of conviction in today's advance? Or an early shift to the holiday weekend mindset?
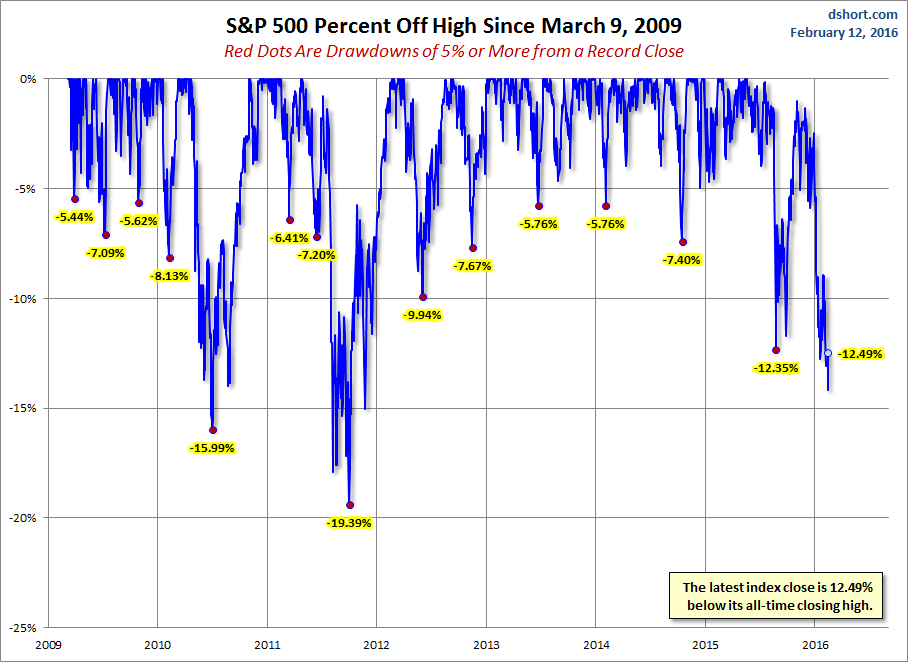
A Perspective on Drawdowns
Here's a snapshot of selloffs since the 2009 trough.
A Perspective on Volatility
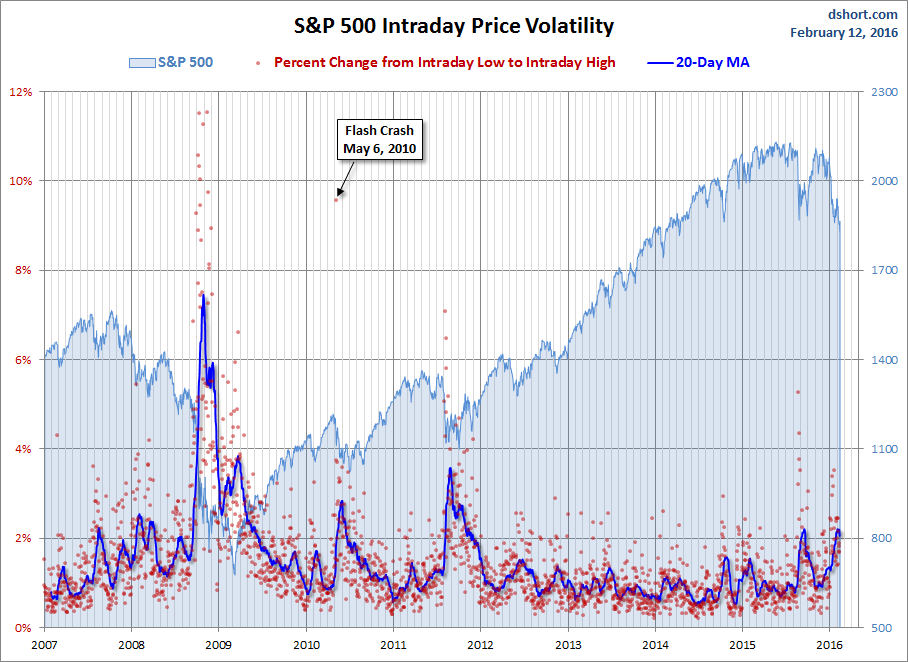
For a sense of the correlation between the closing price and intraday volatility, the chart below overlays the S&P 500 since 2007 with the intraday price range. We've also included a 20-day moving average to help identify trends in volatility.
Here is the same chart with the 50- and 200-day moving averages.
