Russell 2000 Plunges Below June Lows; Bears Strike Again

Published 08/28/2019, 12:32 AM
Updated 07/09/2023, 06:31 AM
US500
-
US2000
-
IXIC
-
SOX
-

It was a second rough day for indices yesterday, with the Russell 2000 taking the brunt of the selling. More troubling, what should have been a good bounce off support was swept away by the bearish engulfing pattern—made all the worse by the recent strong bounce, which has now failed.

Technicals are again net bearish for the index. It will again be time to look at the relationship against the 200-day MA to give us an indication as to when the indices reach historic extremes; the first such test for the Russell 2000 will be when it gets to 1,441.
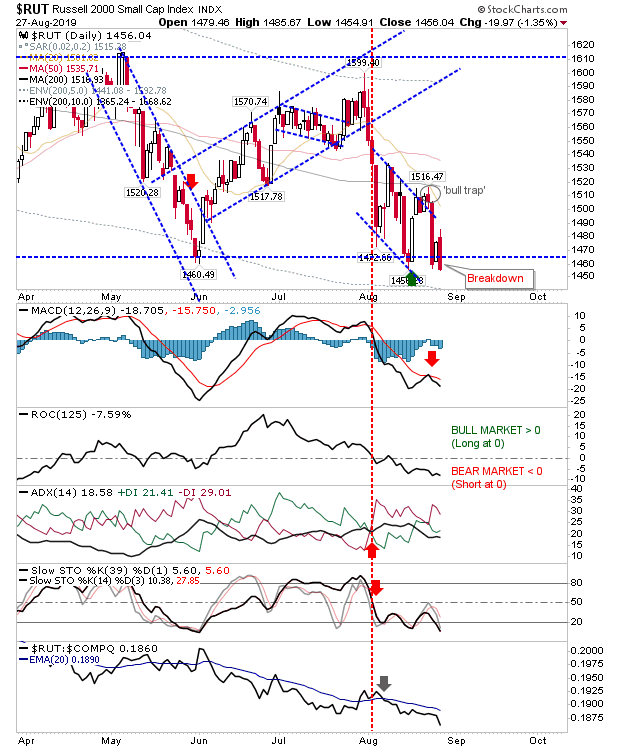
RUT Daily Chart

While it was an ugly day for the Russell 2000, other indices still managed to remain inside their mini-consolidations (nested within a larger consolidation). Though all eyes should be on what happens in the Russell 2000, as it will determine which way the S&P and NASDAQ will go, it's still a tricky trade to call for latter indices as the potential for whipsaw remains very high.

For the S&P, yesterday's selling was accompanied by higher volume distribution. And there was the benefit of another relative performance uptick (only because yesterday's loss was not as great as what impacted the Russell 2000).
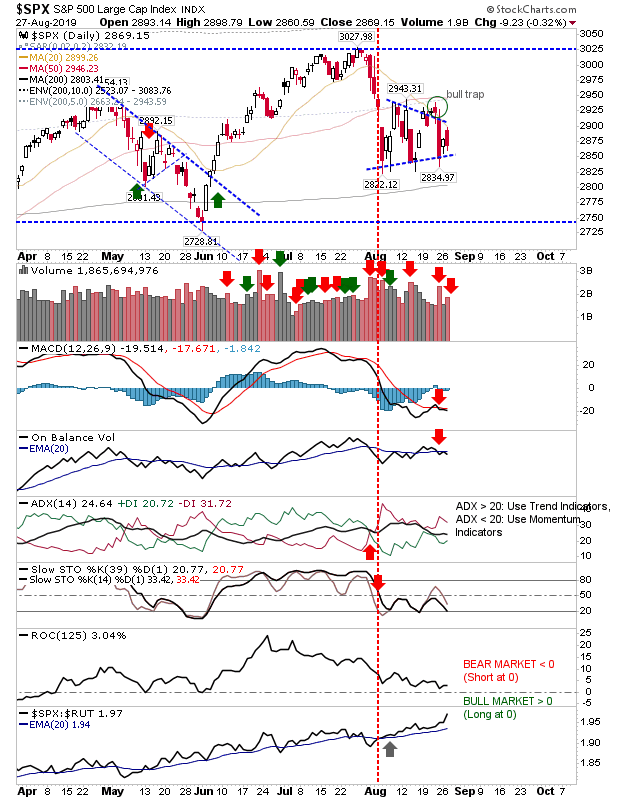
SPX Daily Chart

The NASDAQ closed with a 'bearish cloud cove' pattern, which is not as bearish as the engulfing pattern, and trading volume was lighter—so there was no real damage done to this index. Technicals are still net bearish but it escaped yesterday relatively unscathed.
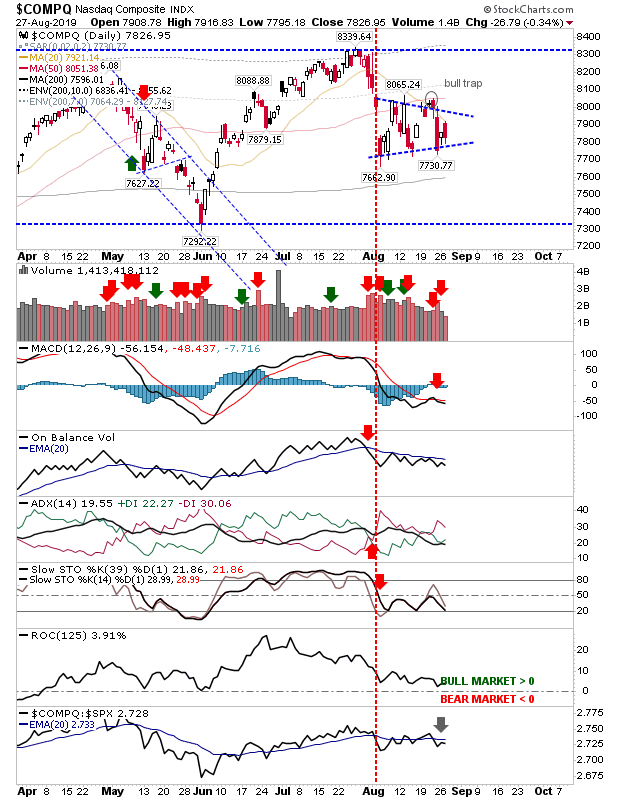
COMPQ Daily Chart

The Semiconductor Index finished on (former) pennant support, but the sequence of three bearish candlesticks in a row suggests this support will fail. Technicals are not as bearish as for the NASDAQ, but they are not exactly great either.
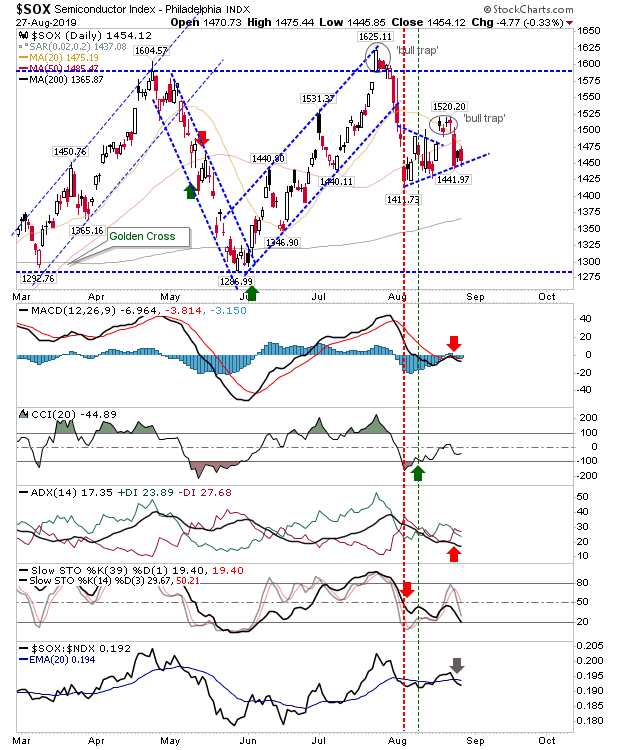
SOX Daily Chart

For today, look to the Russell 2000 to lead other indices, with the NASDAQ and S&P likely to head lower in a 'catch-up' move to the Russell 2000, particularly if the latter accelerates downward.

Latest comments

Loading next article…
Risk Disclosure: Trading in financial instruments and/or cryptocurrencies involves high risks including the risk of losing some, or all, of your investment amount, and may not be suitable for all investors. Prices of cryptocurrencies are extremely volatile and may be affected by external factors such as financial, regulatory or political events. Trading on margin increases the financial risks.
Before deciding to trade in financial instrument or cryptocurrencies you should be fully informed of the risks and costs associated with trading the financial markets, carefully consider your investment objectives, level of experience, and risk appetite, and seek professional advice where needed.
Fusion Media would like to remind you that the data contained in this website is not necessarily real-time nor accurate. The data and prices on the website are not necessarily provided by any market or exchange, but may be provided by market makers, and so prices may not be accurate and may differ from the actual price at any given market, meaning prices are indicative and not appropriate for trading purposes. Fusion Media and any provider of the data contained in this website will not accept liability for any loss or damage as a result of your trading, or your reliance on the information contained within this website.
It is prohibited to use, store, reproduce, display, modify, transmit or distribute the data contained in this website without the explicit prior written permission of Fusion Media and/or the data provider. All intellectual property rights are reserved by the providers and/or the exchange providing the data contained in this website.
Fusion Media may be compensated by the advertisers that appear on the website, based on your interaction with the advertisements or advertisers.
© 2007-2025 - Fusion Media Limited. All Rights Reserved.