Russell 2000 Clears 200-Day MA As Indices Consolidate

Published 10/18/2019, 12:16 AM
Updated 07/09/2023, 06:31 AM
NDX
-
US500
-
IWM
-
SOX
-

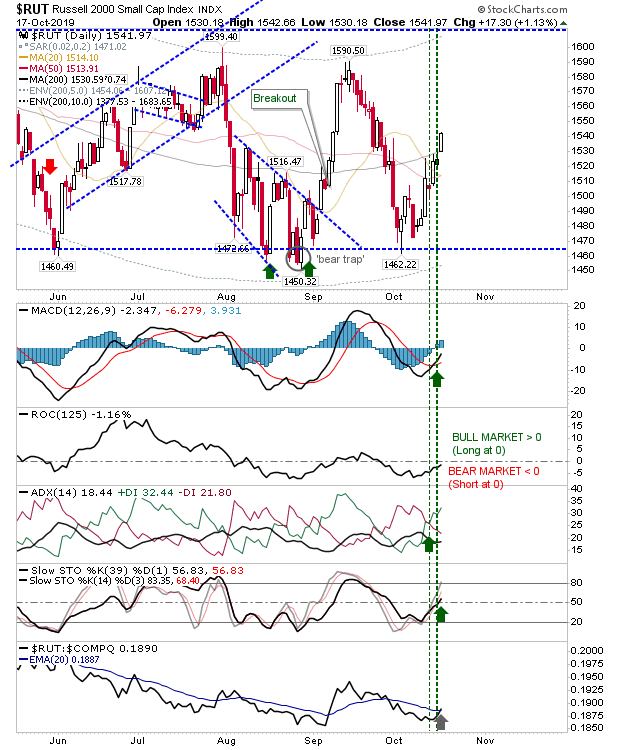
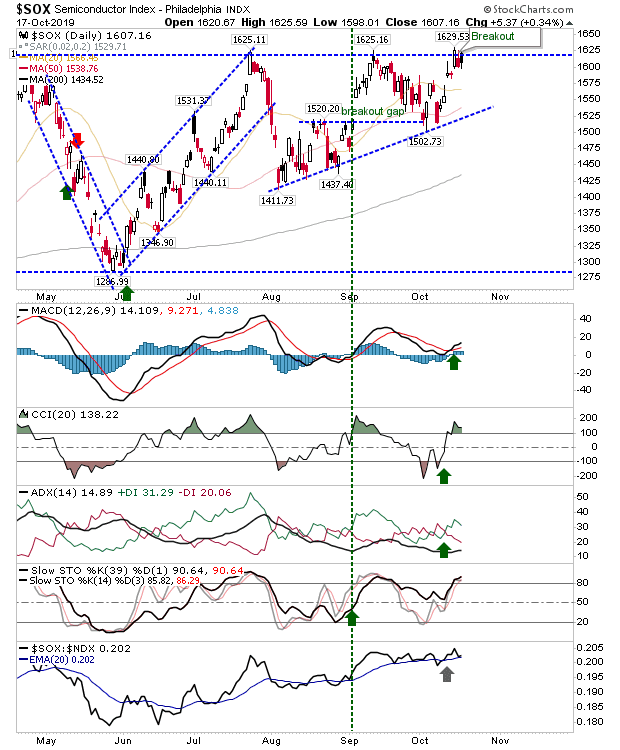
The Russell 2000 pushed above its 200-day MA as other indices had a quiet day. Although all indices remain stuck inside their multi-year trading ranges, the Semiconductor Index is again trying to break clear.
RUT Daily Chart

With the gain in the Russell 2000 technicals moved into a net bullish technical stance. It's still a long way from challenging trading range resistance but it has at least squeezed shorts who were perhaps banking on a support breakout in early October.

The Semiconductor Index continues to toy with a breakout. The potential 'bull trap' looks to have failed after one day - another good sign that it's only a matter of time before the breakout is confirmed. Technicals are net bullish and relative performance, while scrappy, has moved steadily higher. This will help the Nasdaq and Nasdaq 100 in their attempt to breakout.
SOX Daily Chart

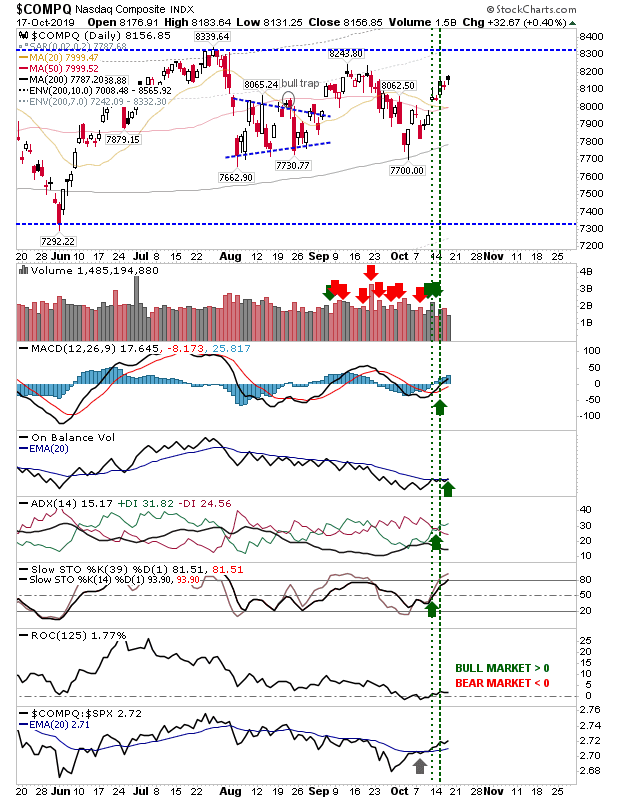
While the Nasdaq and Nasdaq 100 will benefit from strength in the Semiconductor Index, there wasn't much going on in these indices today.
COMPQ Daily Chart

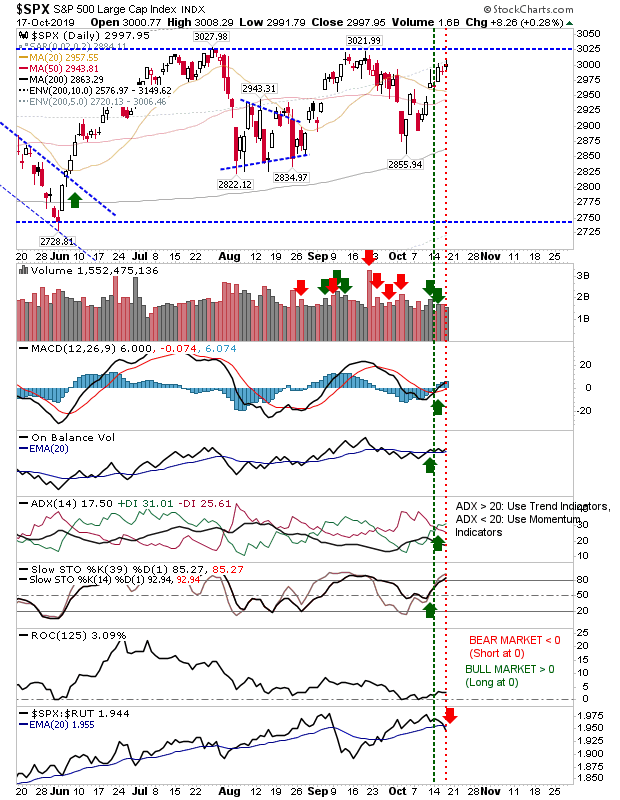
The S&P didn't do a whole lot either.
SPX Daily Chart

While the Russell 2000 is doing its best to garner some headlines it's a long way from making any real noise. The Semiconductor Index is the only game in town at the moment.

Latest comments

Loading next article…
Risk Disclosure: Trading in financial instruments and/or cryptocurrencies involves high risks including the risk of losing some, or all, of your investment amount, and may not be suitable for all investors. Prices of cryptocurrencies are extremely volatile and may be affected by external factors such as financial, regulatory or political events. Trading on margin increases the financial risks.
Before deciding to trade in financial instrument or cryptocurrencies you should be fully informed of the risks and costs associated with trading the financial markets, carefully consider your investment objectives, level of experience, and risk appetite, and seek professional advice where needed.
Fusion Media would like to remind you that the data contained in this website is not necessarily real-time nor accurate. The data and prices on the website are not necessarily provided by any market or exchange, but may be provided by market makers, and so prices may not be accurate and may differ from the actual price at any given market, meaning prices are indicative and not appropriate for trading purposes. Fusion Media and any provider of the data contained in this website will not accept liability for any loss or damage as a result of your trading, or your reliance on the information contained within this website.
It is prohibited to use, store, reproduce, display, modify, transmit or distribute the data contained in this website without the explicit prior written permission of Fusion Media and/or the data provider. All intellectual property rights are reserved by the providers and/or the exchange providing the data contained in this website.
Fusion Media may be compensated by the advertisers that appear on the website, based on your interaction with the advertisements or advertisers.
© 2007-2025 - Fusion Media Limited. All Rights Reserved.