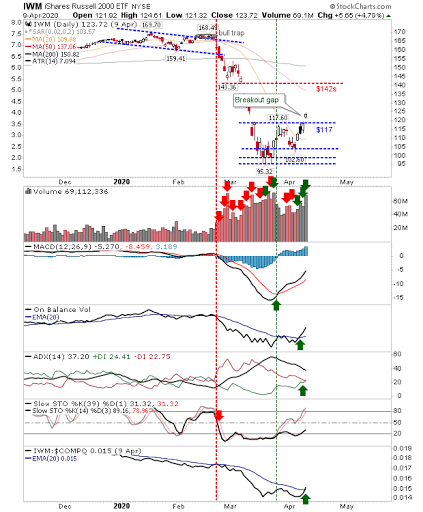
It started with the S&P 500 but now the Russell 2000 (via iShares Russell 2000 ETF (NYSE:IWM)) has managed to follow suit with a breakout of its own. The move above $117 has come with a breakout gap, and has room to maneuver before it encounters resistance at its 50-day MA or the March breakdown gap.
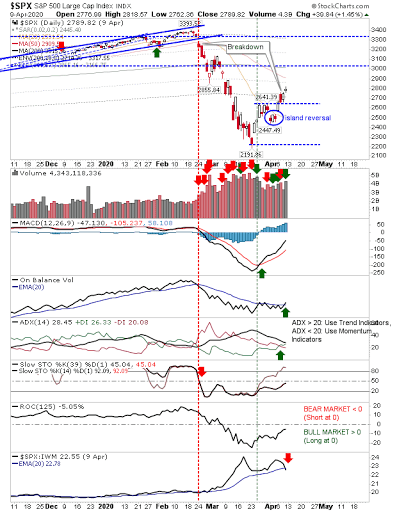
The S&P added just over a percentage point on Thursday, mostly from the opening gap, but was able to maintain that by the close of business. The 50-day MA has already generated a 'death cross' with the 200-day MA—with the 50-day MA now fast approaching as possible resistance. Volume did climb in a sign of accumulation which was also enough to see a 'bull' cross in On-Balance-Volume. If Stochastics [39,1] are able to cross the mid-line then technicals would return to a net bullish state; quite the reversal after a torrid few weeks.
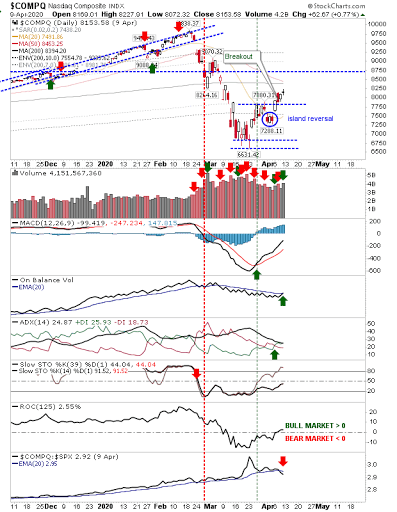
The NASDAQ didn't enjoy the same gap move as the S&P, but did close with a small doji. It's 50-day MA hasn't yet crossed below its 200-day MA; but both moving averages are very close to becoming active resistance. After an extended period of outperformance against the S&P it now finds itself entering a period as a laggard—another sign things could get tough for the index. While the index is above 7,880 the breakout remains valid, but drop below this line an a 'bull trap' emerges and potentially worse to come.
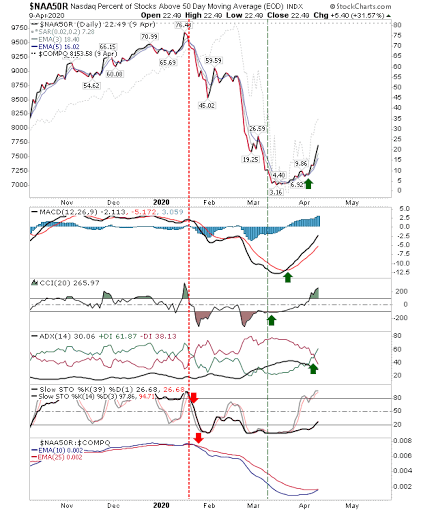
If you are a follower of AllStartCharts by J.C. Parets he will have probably mentioned the Percentage of NASDAQ Stocks above the 200-day MA has moved above the 20% trigger line to buy (after an undercut of 15%). It will be interesting to see if this indicator can remain above 20% even if sellers are able to squeeze the index.
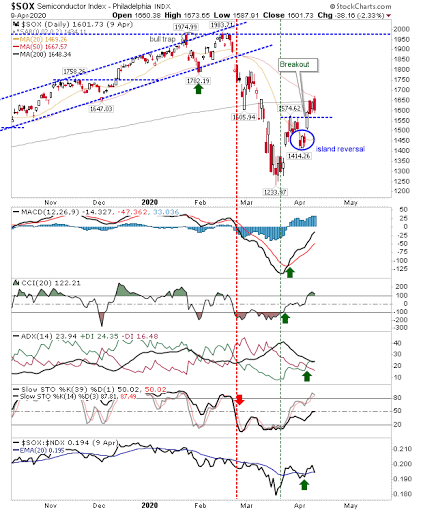
The worry for the NASDAQ is the bearish engulfing pattern for the Semiconductor Index as it ran into resistance of its converged 50-day and 200-day MAs. The index hasn't negated the breakout, but with Stochastics [39,1] at the 50 midline—if this is a bear market—then this test of the midline might be as far as it gets to the upside.
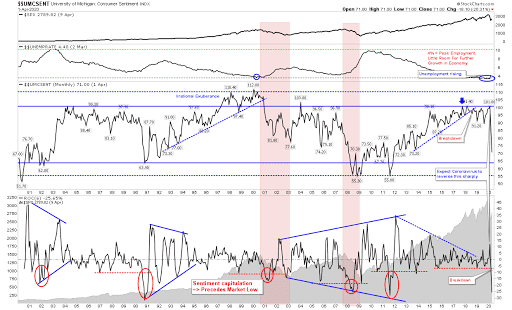
The collapse in Consumer Confidence has in the past has not always coincided with the market bottom—and hasn't always been negative to the market—so we will see what the current collapse will do. However, the rise in unemployment will not help and there could be a long road ahead before things become a new upturn.
For this week, bulls will want to see a push through 50-day and 200-day MAs which will open up for a test of the highs of the first bounce since the decline began.
