US Markets
- S&P 500 Futures -5 points
- US 10-Year 1.54%
- Oil $54.55
- Dollar Index 97.86
- VIX 22.25
International Markets
- Shanghai Composite +0.25%
Economic Data
It doesn’t sound recessionary to me. Wow. Maybe something else is weighing on yields. Oh yeah, that is right, the rest of the world, and a the search for yield.
The GDPNow Forecast is due today, I expect a reading north of 2%
The Spread
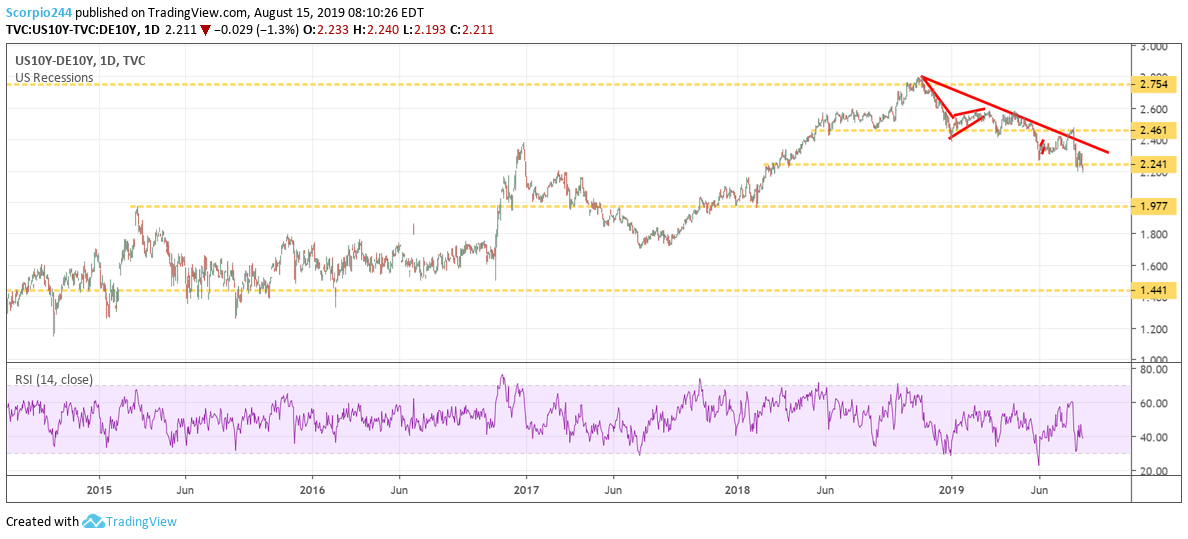
This morning the all-important US-Germany Spread on the 10-Years are finally cracking the all-important 2.25% level. Again, I continue to believe this is the leg lower that puts a bottom into place for yields at least over the short-term. That would send the spread back to 2% and back to its pre-2016 levels. This spread is one of the most important things to watch because this spread helps to create some of the arbitrage opportunities that are responsible for dragging our yields lower.
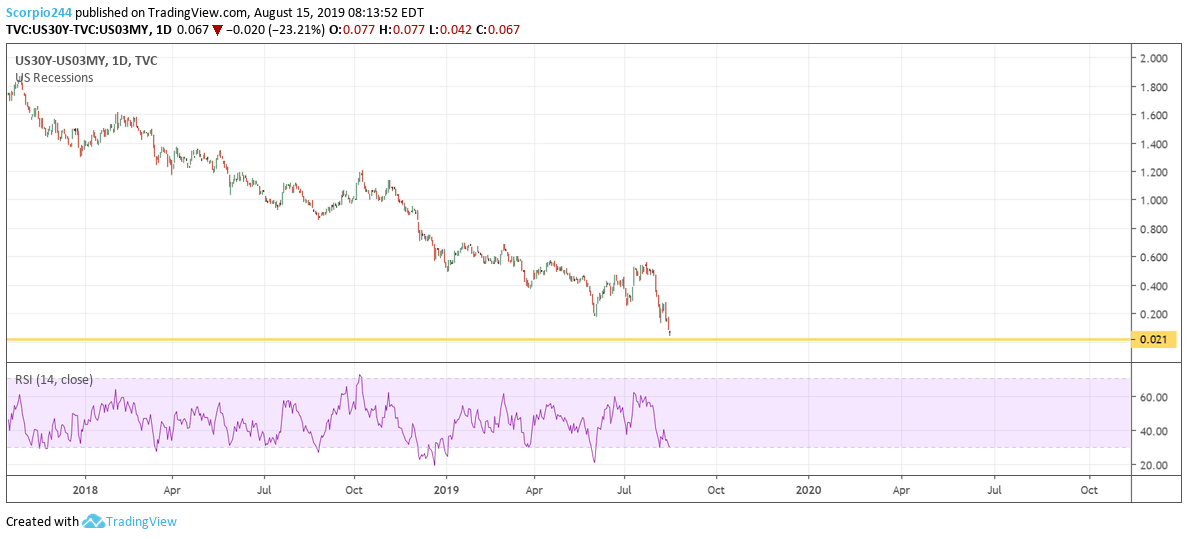
Meanwhile, the 30-year minus the three months spread is around six basis points.
S&P 500 (SPY (NYSE:SPY))
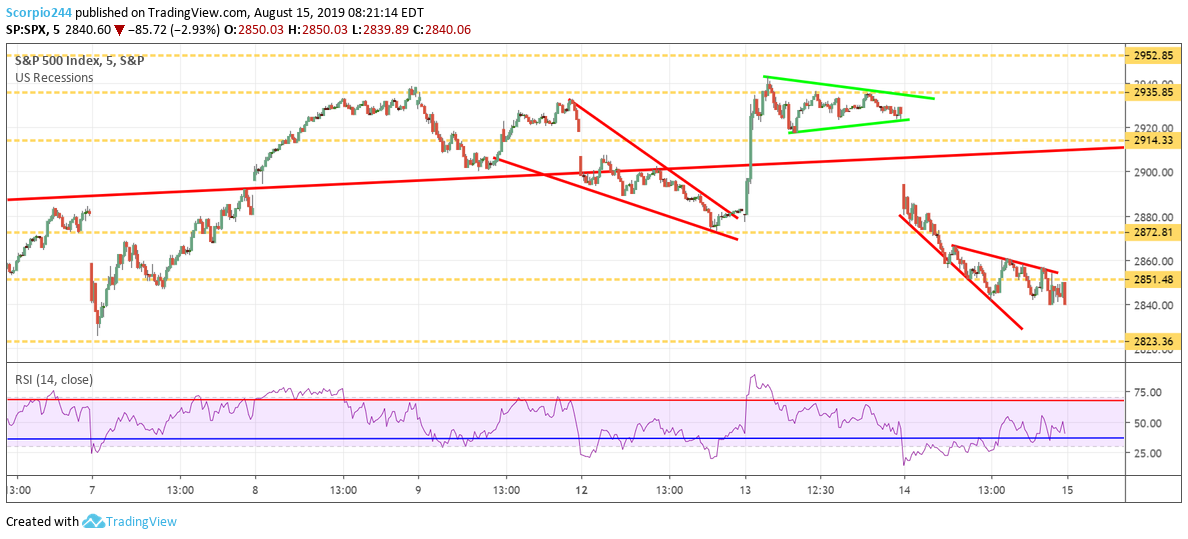
The S&P 500 futures are all over the place today, and it is making it extremely hard to determine the potential direction for stock’s today. It likely means that the economic data due to is likely to have the most significant impact. Sorry, even the charts from yesterday weren’t giving me a good feeling. 2825 is the lows this morning, and that is likely the next level of support.
Russell 2000 (IWM)
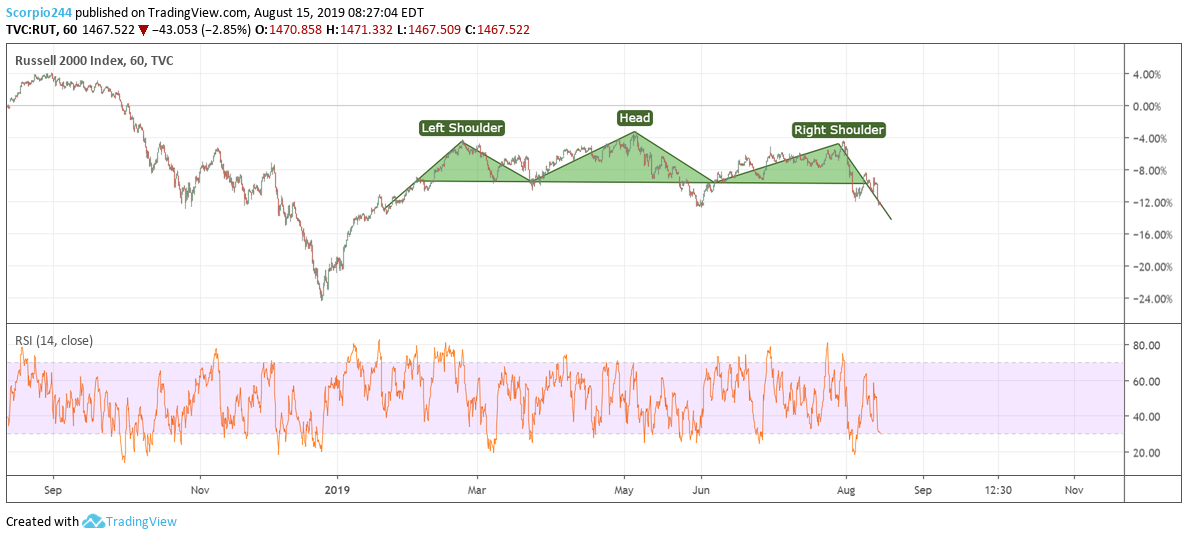
Anyway, I want to be wrong here, and I am hoping my eyes are deceiving me. However, the chart on the Russell 2000 is looking slightly head and shoulder -ish. It makes the current level around 1450 very important. If the index breaks that level, it could be a terrible sign, suggesting a decline to significantly lower levels. Perhaps some of my CMT friends have something to add.
Cisco (NASDAQ:CSCO)
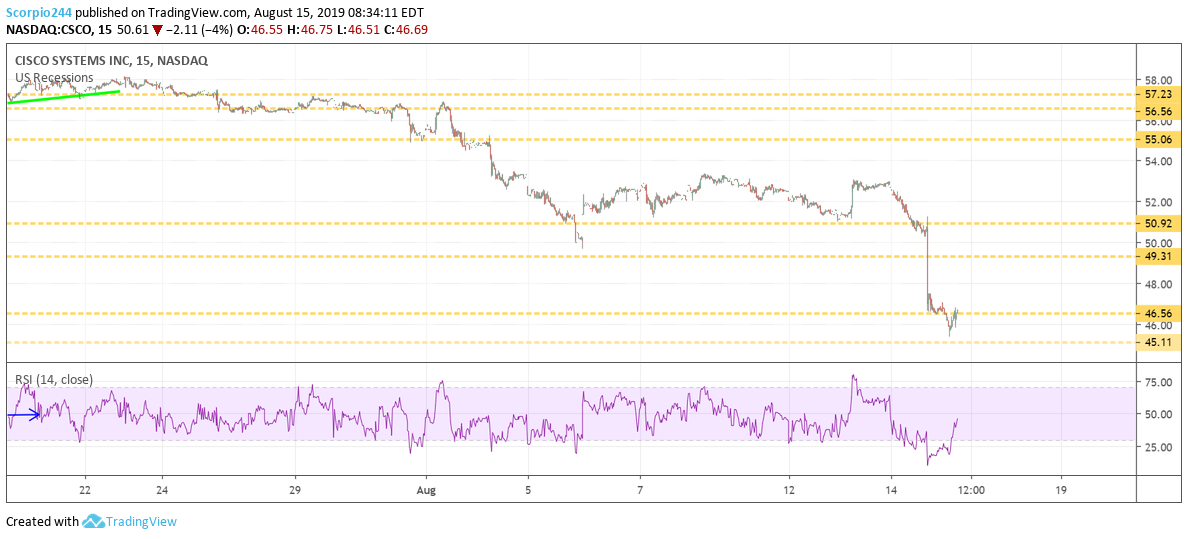
Anyway, Cisco (NASDAQ:CSCO) is falling sharply today, much to my surprise. The move lower seems to be due to the guidance miss, which seems minor in comparison to the prior estimates. It would seem that most of the miss is due to “softness” in China. It sounds more like China is putting Cisco on ice, to make up for the US Huawei ban, that is my interpretation. China makes up about 3% of Cisco’s total revenue. From what I can tell estimates had been calling for Growth of 2.5% in the first quarter for 2020. That was higher than the companies guidance of around 1% at the mid-point. $46.50 is support for the stock.
GE (GE)
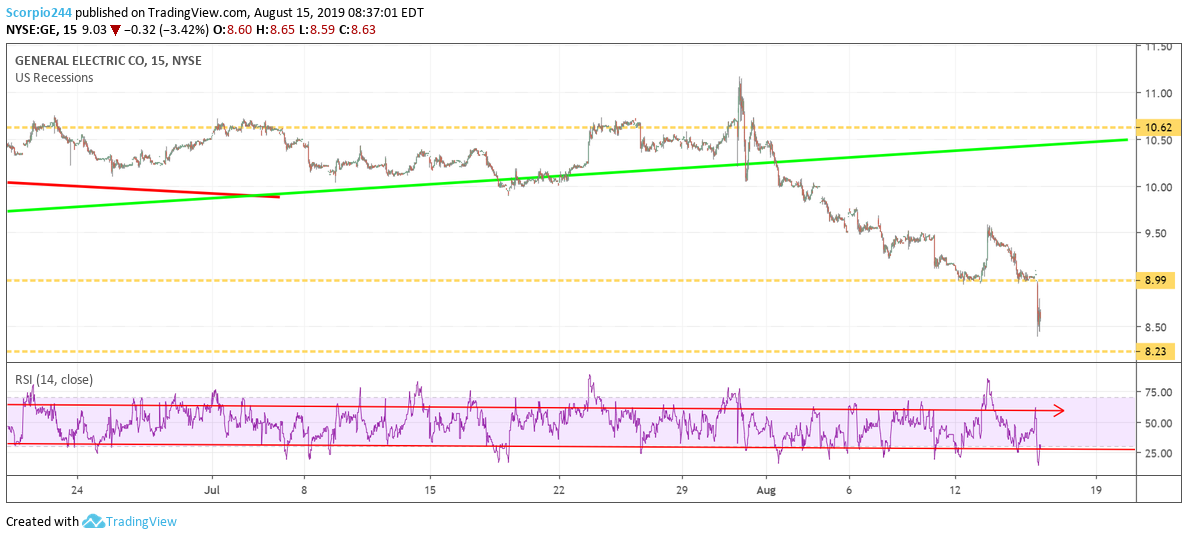
GE is breaking support at $9, and now it sets up a drop to $8.25. The stock is falling after the Bernie Madoff whistler blower is calling into question GE accounting. I don’t know that I’d want to be mention in the same sentence as Bernie Madoff. Indeed not good, and more thing for investors to worry about. It didn’t take long for those put buyers to profit. GE: Game Over
Alibaba (NYSE:BABA)
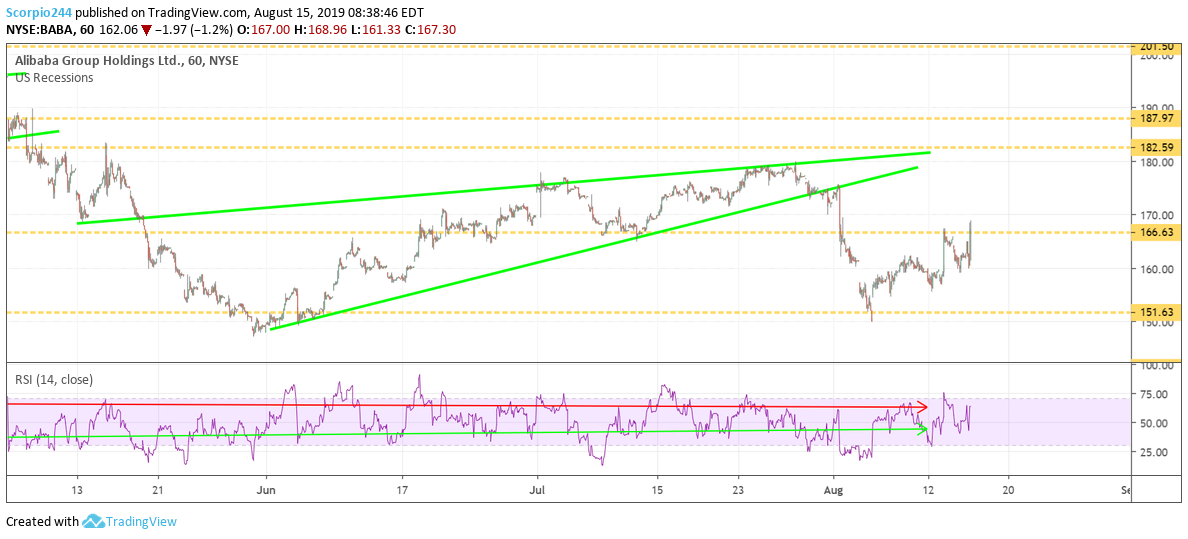
Alibaba (NYSE:BABA) reported better than expected quarterly results, and the stock is rising. But again, the trade war and the currency risk are the most significant weight on this stock for now. $166 is now resistance.
Walmart (NYSE:WMT)
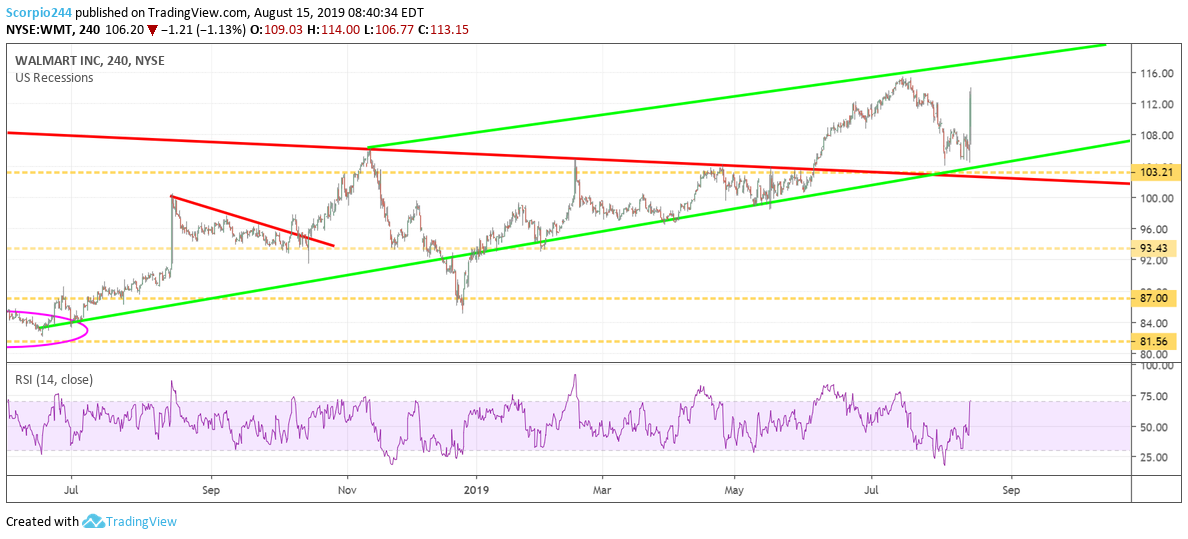
Walmart (NYSE:WMT) is rising after delivering its results. Resistance is around $115.
