The repeal-and-replace health care bill needs a “Yes” vote from the House of Representatives on Thursday, March 23. With it, the financial markets may move higher on the belief that Trump/Congress will be able to pass corporate-friendly legislation from tax overhaul to regulatory reform. Without it, risk assets may stumble on the fear that political leaders will be unable to provide ambitious stimulus measures down the road.
The prospect of lower taxes has always been at the heart of the “Trump rally” since early November. To a lesser extent, the notion that the incoming president would support a $1 trillion package for roads, bridges and infrastructure projects also stoked stock buying flames. With infrastructure spending not showing up in the executive branch’s budget, however, more weight has fallen on the shoulders of tax rate reductions.
Let’s assume that the health bill gets back on track. Are prospective changes to the corporate-tax code all they’re cracked up to be?
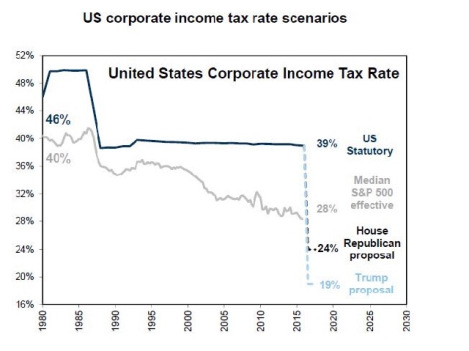
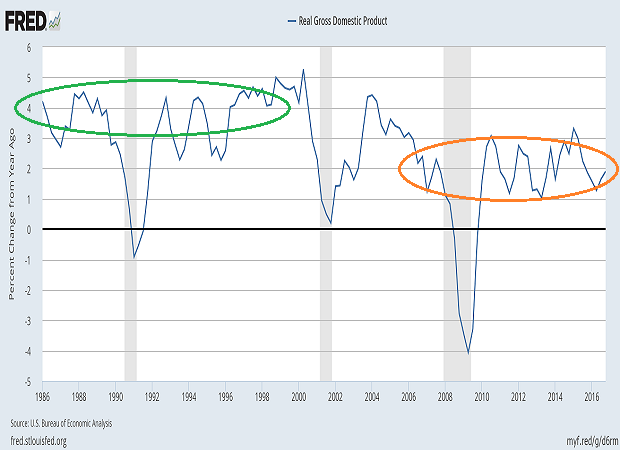
In the chart above, it is easy to see that the typical S&P 500 corporation has experienced ever-decreasing effective taxes for the last 30 years. Yet the consistent decline in effective tax rates has neither boosted the long-term trend of economic growth nor prevented recessions. Lower gross domestic product (GDP) alongside recessions may have an adverse effect on profits, sales as well as stock prices.
Might reducing the statutory corporate tax rate lead to even lower effective corporate tax rates, thereby boosting corporate profits as well as distributions to shareholders? Perhaps. Yet most of it has already been accounted for in the price run-up since the election.
In an optimistic scenario, a 15% reduction in the statutory rate (previous chart above) might lead to a 7% reduction in the effective rate from 28% to 21%. It follows that S&P 500 GAAP profits could, hypothetically, get a 7% boost to $127.14 from the anticipated year-end value ($118.83). Forward P/Es on $127.14 would still be remarkably elevated at 18.4. The 250 point run-up for the S&P 500 since early November (12%), though, has more than accounted for the tax cut stimulus already.
And now it might not come in 2017.
There is still the rollback of regulations to embrace. And an infrastructure package in the neighborhood of $1 trillion, right? Perhaps. Though it is not clear that the market itself buys into the “infrastructure story” anymore.
Consider Aecom (NYSE:ACM) – the highly touted American engineering firm that provides design, consulting, construction, and overall infrastructure services to federal and state governments as well as other businesses. ACM has 95,000 employees across the globe, and is ranked in the upper half of the Fortune 500. It would benefit “bigly” from a government commitment to infrastructure projects. Nevertheless, the stock has been trending lower since the initial election euphoria in November.
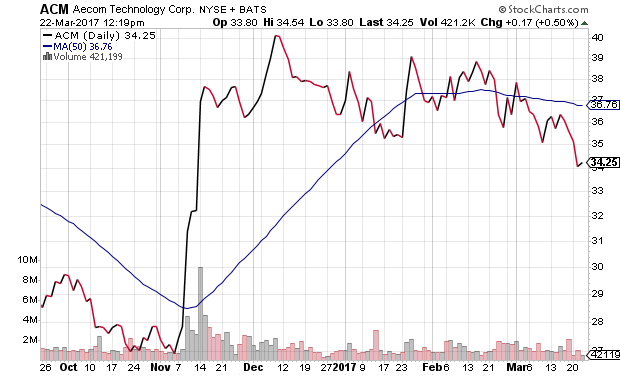
Granted, most folks believe the House will cobble together enough votes to get the health bill over to the Senate. And that may provide a bit of relief for die-hard speculators. Still, investors may wish to examine recent trends that suggest that U.S. stocks have grown weary.
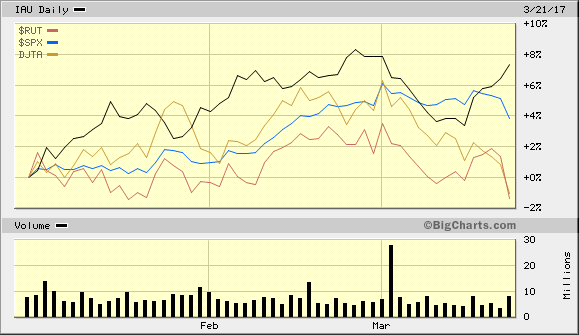
Both the Dow Jones Transportation index as well as the premier gauge for small-company stocks, the Russell 2000, are down in 2017. The S&P 500 is still hanging in there with gains. Yet the big winner? One of the premier hedges against a liquidity event or a pan-market meltdown: gold.
There is still another reason to question the speculative stock hype. The yield curve is flattening. We have the short-end of the yield curve responding to Federal Reserve tightening, yet the longer end of the yield curve (e.g., 10s, 30s etc.) does not agree with the Fed’s optimistic statements about “economic progress.”
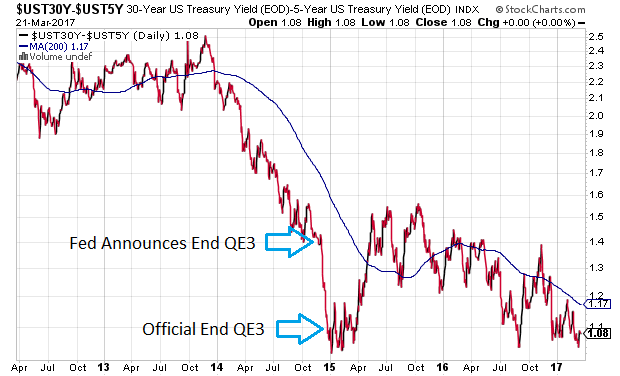
Remember when the Fed announced the end to its rate-manipulating, electronic money creation program on October 29, 2014? (Note: The last trade did not actually settle until December 18, 2014). It is worth noting that since the Fed announced the termination of QE3, the yield curve between 30- and 5-year Treasuries has flattened considerably, and the curve rests near economic recovery cycle lows. That is hardly an endorsement of economic progress; rather, it tends to be a sign of economic weakness.
If one takes a look at the official end to quantitative easing (QE3), one notices that stocks traveled a scary path to nowhere for 22 months, straight up to the election. It was only after the prospect of significant fiscal stimulus from the Trump team that U.S. stocks broke out for 15% price appreciation; the S&P 500 is still up about 12% since November.
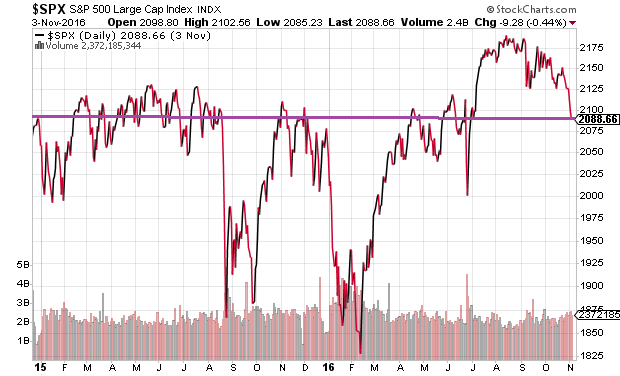
The problems? For one thing, the “W-shaped” price recoveries in 2015 and early 2016 (in the chart above) both came with soothing words of accommodating policy from the Federal Reserve. With the Trump rally providing the Fed with ample cover, the Fed has accelerated its tightening. And yet, Fed tightening becomes increasingly problematic if the current Administration is unable to pick up the slack via fiscal stimulus (e.g., tax cuts, infrastructure spending, etc.).
My question: Why are so many folks rationalizing irrational exuberance? Tax rate reductions are already fully priced in by current stock prices, and those lower tax rates may not even materialize. Infrastructure spending appears to be on the back burner. Gold has been surging. The yield curve is flat (much like Kyrie Irving’s vision of the earth). And stock prices are extremely overvalued on a dozen or more reliable measures of long-term investing returns.
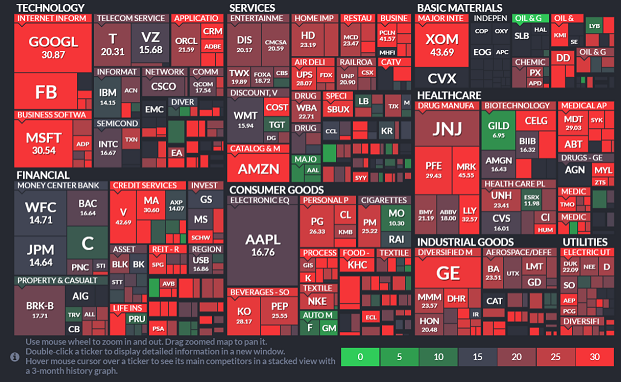
One method for visualizing the overvaluation is a “heat map.” (Let me give credit to Lance Roberts for posting the image.) Simply put, there are very few bargains. The reason one is overwhelmed by a sea of red is because stock prices are exorbitant relevant to profits. They are also extreme relative to operating cash flow, sales and GDP.
Of course, what’s a little speculative fervor between market participants? They’ll get that health bill passed; they’ll move on to a comprehensive tax overhaul. And if it all falls by the wayside, the Federal Reserve will simply reverse course on tightening to provide still more monetary stimulus juice.
I wish I could be equally sanguine about overvaluation being “justified” by what political leaders or monetary authorities can achieve indefinitely. From my vantage point, there will come a time when shareholders will distinguish between their hypothetical net worth in assets (e.g., stocks, real estate, etc.) and the capacity for asset prices to fall rapidly. That’s when investors sell by the droves. Panic takes root.
If valuations were 1982-like bargains or 2009-like bargains, I might be eager to buy the proverbial dip on panicky selling. This time around? Not so much.
That said, if we get a bearish (20%) pullback where the Federal Reserve quickly acknowledges its “third mandate” to support risk asset prices like stocks and real estate, if the central bank rapidly reverses from tightening to rate cuts or a 4th iteration of quantitative easing (QE4), that might very well encourage me to move my 25% cash equivalent position off of the sidelines. Until then, 50% in equities (down from 70%) is as bullish as it gets.
