In what world can aggregate debt of a country/business/household grow faster than its economy/income indefinitely? A world where math and logic no longer exist.
Consider the circumstances for the United States. Economic growth as measured by the pace of gross domestic product (GDP) used to move in lockstep with the expansion of the country’s debt. However, in 1971, the growth rates began decoupling in earnest. That was the year President Nixon terminated gold’s relationship with the U.S. dollar. Not surprisingly, once money ceased to be backed by anything other than trust in the U.S. government itself, budget deficits and excessive borrowing became the norm.
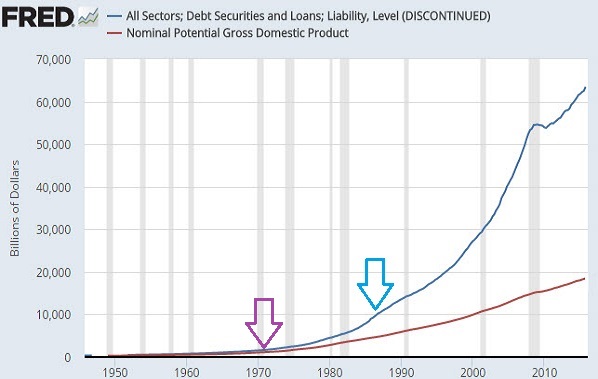
In truth, Nixon does not deserve all of the blame for chronic deficits and unsustainable debt levels. Something else transpired in 1986 that caused the growth rate of federal debt to ratchet up dramatically; that is, growth in debt was not merely decoupling from GDP, it was distancing itself exponentially.
What happened in 1986? Alan Greenspan assumed the chair at the Federal Reserve. Since Greenspan began his tenure, the Fed has employed its muscle to manipulate borrowing costs lower and lower. The three-decade-long manipulation provided the government a permanent green light to spend recklessly (via debt).
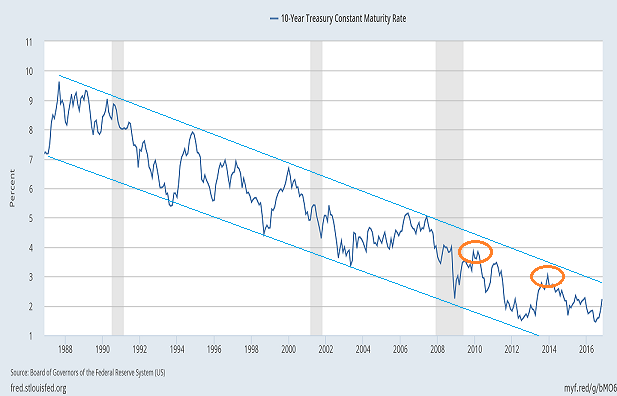
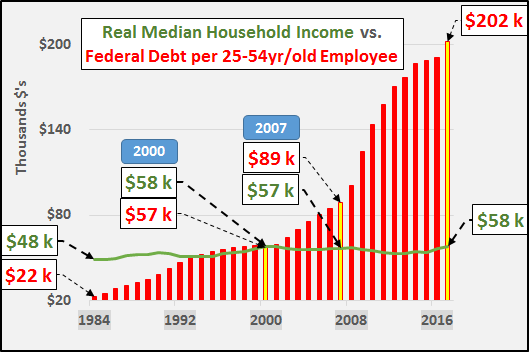
Today, congressional leaders no longer contemplate reducing federal debt itself. With federal government obligations at $20 trillion, unfunded liabilities exceeding $100 trillion, as well as annual budget deficits of $1 trillion, the $3.3 trillion in federal tax revenue (annual) is insufficient to reduce principal; rather, the most that any politician can hope for is an ability to tackle the interest payments ad infinitum.
Employees in the prime demographic (25-54) remain blissfully unaware of their predicament. Indeed, the only way for one to pay his/her share of the interest on federal debt is for monetary policy leaders to forever exert downward pressure on borrowing rates. It’s no wonder that bond icon Bill Gross believes that if the current 10-year yield (2.5%) rose a single percentage point to 3.5%, the U.S. would tumble into a recession.
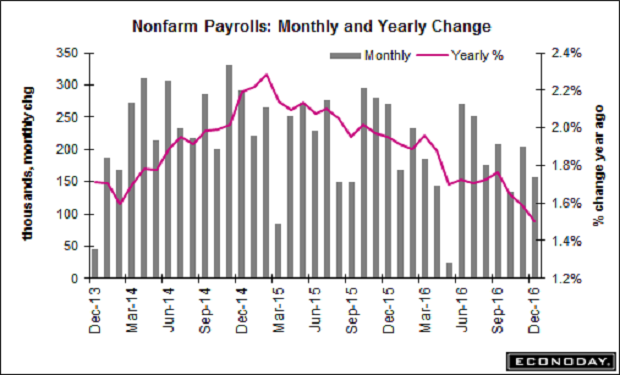
Perhaps ironically, plenty of economists disagree with Mr. Gross’s assessment. Many seem convinced that if the 10-year yield rose toward 3.5%, it would merely confirm the robustness and the resilience of the U.S. economy in 2017. Not me. From where I stand, job growth is already slowing and the economic expansion is already long in the tooth.
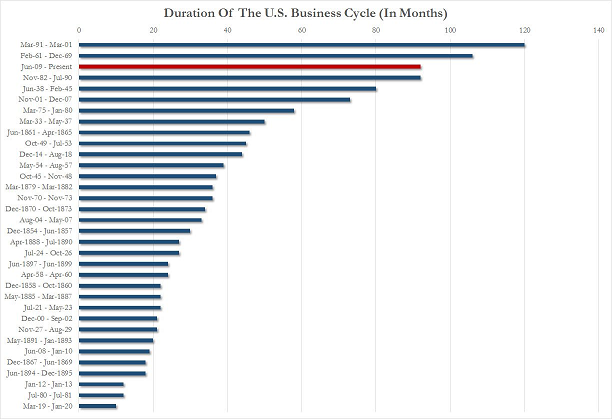
A 10-year yield that moved toward 3.5%? Heck, even 3%? If it happens, we might as well ask the Fed to start buying hundreds of billions of bonds in a fourth round of electronic money creation (a.k.a. “QE4”). After all, the illusion of wealth today is largely tied up in the Federal Reserve’s aforementioned manipulations – actions taken to reflate stock and real estate prices. Both asset classes have skyrocketed since the Fed hinted at QE3 early in the summer of 2012.
For instance, let’s look at corporate shares in the S&P 500. Since the end of the 2nd quarter in 2012 (6/30), collective corporate earnings have risen a meager 8.3%. In contrast, the price of the S&P 500 relative to earnings per share (P/E ratio) has leaped an astonishing 59.1%. That’s a fancy way of saying that virtually all of the S&P 500’s gains since the discussion of QE3 in mid-2012 are attributable to buyer willingness to pay ever-increasing premiums above fair value, not the genuine growth in corporate profits.
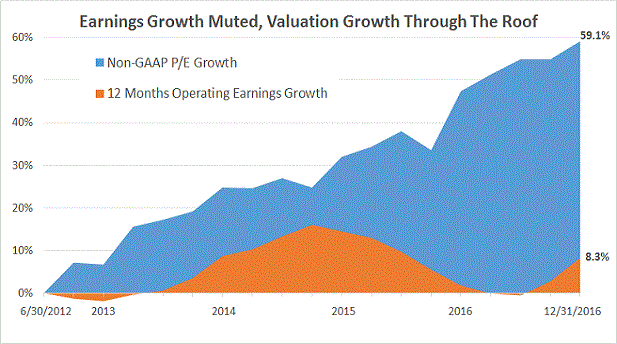
Well, then, what constitutes fair value? On a baker’s dozen of venerable valuation methodologies – TTM P/E (above chart), TTM GAAP P/E, Forward P/E, Shiller’s CAPE, P/OCF, EV/EBITDA, price-to-sales (P/S), EV/sales (median), Q Ratio, market cap to GDP, PEG Ratio, margin debt, household percentage ownership of stocks to total financial assets – the S&P 500 demonstrates extremes rarely seen in history. Indeed, shareholders are essentially looking at the 1st, 2nd or 3rd priciest stock market ever, where competition only exists with 1929 and/or 2000. Note: Stocks were better valuation prospects in 2008’s financial collapse than they are at the given moment.
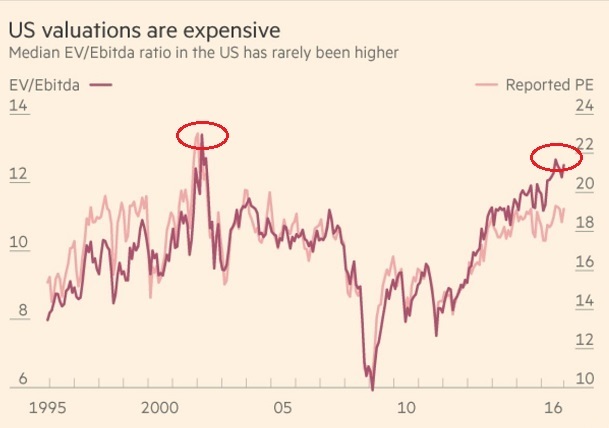
Even those in the “low-rates-justify-everything” crowd do not realize that the 10-year yield traded around the same levels for two decades from 1935-1954. None of the valuation measures came in at the insanely high levels of 2017. What’s more, there were still four bear markets in those 20 years of ultra-low rates – 1937-1938 (-49%), 1938-1939 (-23%), 1939-1942 (-40%), 1946-1947 (-23%).
Similarly, the “low-rates-justify-everything” crowd is ignoring the minuscule equity risk premium (ERP). With the 10-year yield near 2.5% and the GAAP E/P around 4.0%, there is a meager 1.5% excess return for investing in stocks over risk-free government treasuries. Not many investors in history benefited when the equity risk premium (ERP) came in at a measly 1.5%. Even the hackneyed argument on the S&P 500’s dividend yield exceeding the 10-year yield has faded away.
One can say that fundamental valuation is irrelevant. Of course, euphoric dot-com devotees said the same thing about the “New Economy” and the NASDAQ in 2000. One might also decide that the only thing that matters is the strong technical uptrend for the 50-day and 200 day moving averages. Then again, the Relative Strength Index (RSI) has not seen “technically overbought” readings this extreme since the early stages of the current bull market (April, 2010).
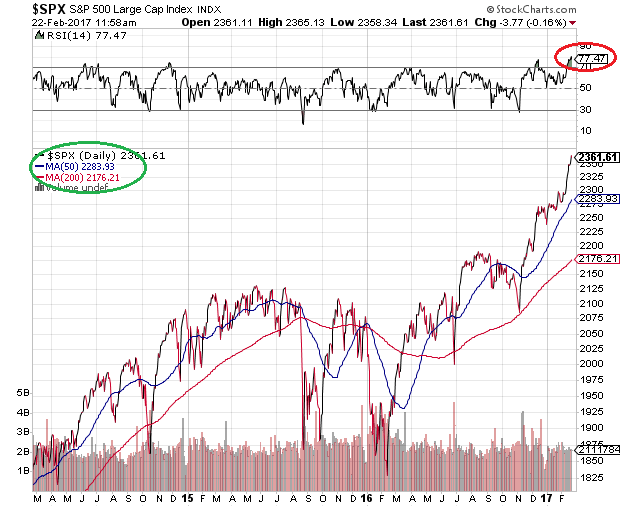
Bottom line? Apply insurance principles to your investing endeavors. Whether you employ technical trendlines like the 50-day and/or 200-day moving average, or whether you prefer fundamental valuation or macro-economic indicators, take measures to lose less in the inevitable bearish reversion.
I downshifted my moderate growth-and-income client portfolios in December of 2014 from roughly 65%-70% widely diversified stock to 50%-55% high quality stock. At that time, the S&P 500 hit 2075. It has since witnessed several significant sell-offs (10% plus), traded sideways for roughly 20 months, then powered ahead in the “Trump rally” to 2365.
Would it have been “better” to remain at a target growth allocation? It can certainly be debated. From a risk-reward perspective, however, I will always opt for less risk of significant loss when the probability of meaningful reward is diminishing.
